I recently found a speed comparison visualiazation between caches by Benj Dicken in this X post, and since i couldn’t find anywhere to play with his visualization, I recreated it here (which is mostly why I am writing this post 😅 ):
Simulazione in slow motion: 1.0e+9x slower
I think this visualization is beautiful because it lets you grasp why paying awerness to cache while programming let’s you write…well, faster algorithms!
Take a look at the example below to see why knowing your hardware is relevant.
Row-major vs Column-major
Consider a 4x4 matrix stored in memory. While we visualize it as a grid, the physical storage is linear. In C/C++, arrays use row-major order, meaning rows are stored sequentially:
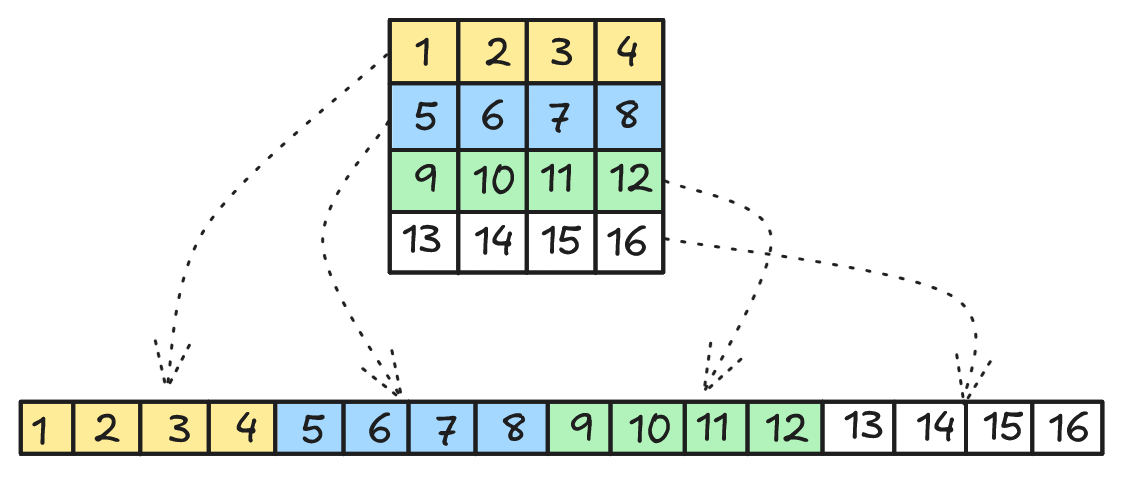
In the image above you can see (top) the logical view of the matrix and (bottom) the physical view of it.
Cache behavior: Row-Major Access
Suppose we are in a Row-major environment and we access the matrix row-first, i.e like this:
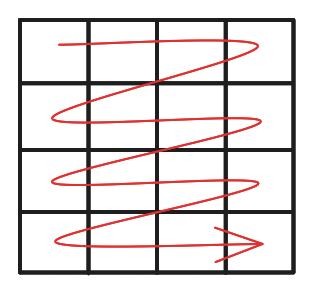
Also suppose that we have only one level of cache which has a size of 32 bytes (holds 4 integers) and the cache lines are of size 16 bytes (holds 2 integers), when iterating through the matrix this is how cache behaves:
| step | index | cache (before) | cache (after) | cache miss |
|---|---|---|---|---|
| 1 | A[0][0] | - | [1,2] | miss |
| 2 | A[0][1] | [1,2] | [1,2] | hit |
| 3 | A[0][2] | [1,2] | [1,2], [3,4] | miss |
| 4 | A[0][3] | [1,2], [3,4] | [1,2], [3,4] | hit |
| 5 | A[1][0] | [1,2], [3,4] | [3,4], [5,6] | miss |
| … | … | … | … | … |
| 16 | A[3][3] | [13,14], [15,16] | [13,14], [15,16] | hit |
You can see that everytime there is a cache miss a cache line (2 integers) is transfered to the cache.
Result: iterating row-first gives us 50% cache miss rate.
Cache behavior: Column-Major Access
Suppose you are in the same environment as above, but this time you iterate through the matrix column-first, i.e like this:
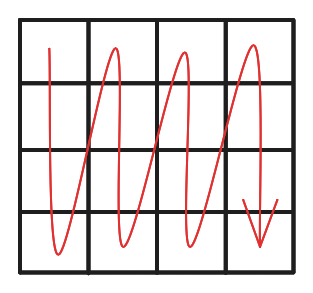
This is the access pattern you get:
| step | index | cache (before) | cache (after) | cache miss |
|---|---|---|---|---|
| 1 | A[0][0] | - | [1,2] | miss |
| 2 | A[1][0] | [1,2] | [1,2], [5,6] | miss |
| 3 | A[2][0] | [1,2], [5,6] | [5,6], [9,10] | miss |
| 4 | A[3][0] | [5,6], [9,10] | [9,10], [13,14] | miss |
| 5 | A[0][1] | [9,10], [13,14] | [1,2], [3,4] | miss |
| … | … | … | … | … |
| 16 | A[3][3] | [5,6], [9,10] | [9,10], [13,14] | miss |
Notice how this time you are wasting every cache line is brought into cache.
Result: iterating column-first gives us 100% cache miss rate.
Benchmarking Row vs. Column Access
This C program demonstrates the performance difference:
#include <stdio.h>
#include <stdlib.h>
#include <time.h>

#ifndef N
#define N 4096
#endif

int mat[N][N] = {0};

#ifdef COLUMN_FIRST
void iterate() {
    int i, j;
    for (j = 0; j < N; j++) {
        for (i = 0; i < N; i++) {
            mat[i][j] += 1; // Column-major access
        }
    }
}
#else
void iterate() {
    int i, j;
    for (i = 0; i < N; i++) {
        for (j = 0; j < N; j++) {
            mat[i][j] += 1; // Row-major access
        }
    }
}
#endif

int main() {
    clock_t start, end;
    double time;
    start = clock();
    iterate();
    end = clock();
    time = ((double)(end - start)) / CLOCKS_PER_SEC;
    printf("Time: %fs\n", time);
    return 0;
}
Results:
- For column first compile the code with the
COLUMN_FIRSTflag
$ gcc -DCOLUMN_FIRST script.c -o columnfirst
$ ./columnfirst
Time: 0.524808s
- For the row first compile the code without any flag
$ gcc script.c -o rowfirst
$ ./rowfirst
Time: 0.178195s
Column-first access is more than double slower.
We can prove that this is due to cache misses using profiling tools like perf stat.
- Row-First Performance
$ perf stat -e cache-references,cache-misses,cycles,instructions,branches,faults,migrations ./rowfirst
Time: 0.178195s

 Performance counter stats for './rowfirst':

           285.676      cache-references
           137.135      cache-misses              #   48,004 % of all cache refs
       285.008.599      cycles
       468.998.728      instructions              #    1,65  insn per cycle
        35.080.708      branches
            32.825      faults
                 1      migrations

       0,187476169 seconds time elapsed

       0,117382000 seconds user
       0,068810000 seconds sys
- Column-First Performance
$ perf stat -e cache-references,cache-misses,cycles,instructions,branches,faults,migrations ./columnfirst
Time: 0.524808s

 Performance counter stats for './columnfirst':

        17.404.939      cache-references
        15.918.948      cache-misses              #   91,462 % of all cache refs
       838.541.074      cycles
       469.594.444      instructions              #    0,56  insn per cycle
        35.178.138      branches
            32.826      faults
                 2      migrations

       0,536358950 seconds time elapsed

       0,484255000 seconds user
       0,047631000 seconds sys
You can see that in row-first access we get 48,004% cache misses, while in column first 91,462%. Almost double, like seen in the section above.
Ta-Da!
Luigi