Bézier Curves
Bézier curves are a fundamental concept in computer graphics and vector drawing. They are used to describe curves by controlling points called ‘control points’. These curves were introduced by Pierre Bézier in the 1960s as a method of representing curves on computer screens. A Bézier curve has the form
$$\underline{x}(t) = \sum_{i=0}^n \underline{b}_i B_i^n(t), t\in[0,1]$$
Where,
$$B_i^n(t) = {n \choose i}t^i(1-t)^{n-i}, i= 0,…,n$$
are the $n+1$ basic Bernstein polynomials.
NIn the editor below, I have implemented an interactive version of these curves. The algorithms I have implemented are the curve computation algorithm or the de Casteljau algorithm and the degree elevation algorithm.
Editor instructions:
- 2 left-clicks to add a new control point
- move control points by dragging while holding down the left mouse button
Warning: If you are not correctly seeing (or not seeing) the sketch below correctly, visit this link. Or this link to see and edit the source code.
De Casteljau Algorithm
De Casteljau’s algorithm is a stable iterative method for calculating points on a Bézier curve. The algorithm works like this: $$\underline{b}_i^0(t) = \underline{b}_i$$ $$\underline{b}_i^r(t) = (1-t)\underline{b}_i^{r-1}(t)+t\underline{b}_k^{r-1}(t)$$ $$k=i+1;r=1,…,n; i=0,…,n-r$$
Where $$\underline{b}_0^n(t) = \underline{x}(t)$$ is the point on the Bézier curve associated with the value of the parameter $t$.
Degree elevation Algorithm
The degree elevation algorithm transforms a Bézier curve of degree $n$ into a Bézier curve of degree $n+1$:
$$\underline{x}(t)=\sum_{i=0}^n \underline{b}_i B_i^n(t)$$
$$= \sum_{i=0}^{n+1} \underline{c}_i B_i^{n+1}(t)$$
in this way:
$$ \underline{c}_i= \frac{i}{n+1} \underline{b}_k + \frac{n-i+1}{n+1}\underline{b}_i$$ $$k = i-1; i=1,…,n$$
$$\underline{c}_0=\underline{b}_0,\underline{c}_m=\underline{b}_n; m = n+1$$
3-dimensional Bézier curve
In the editor above, the control points of the bezier curve are control points in 2 dimensions. Namely, $$\underline{b}_i = { b_x \choose b_y}$$
However, all the algorithms seen above also work for three-dimensional curves, where the control points will also have a $z$ component. All the algorithms therefore remain unchanged,
Warning: If you are not correctly seeing (or not seeing) the sketch below correctly, visit this link. Or this link to see and edit the source code.
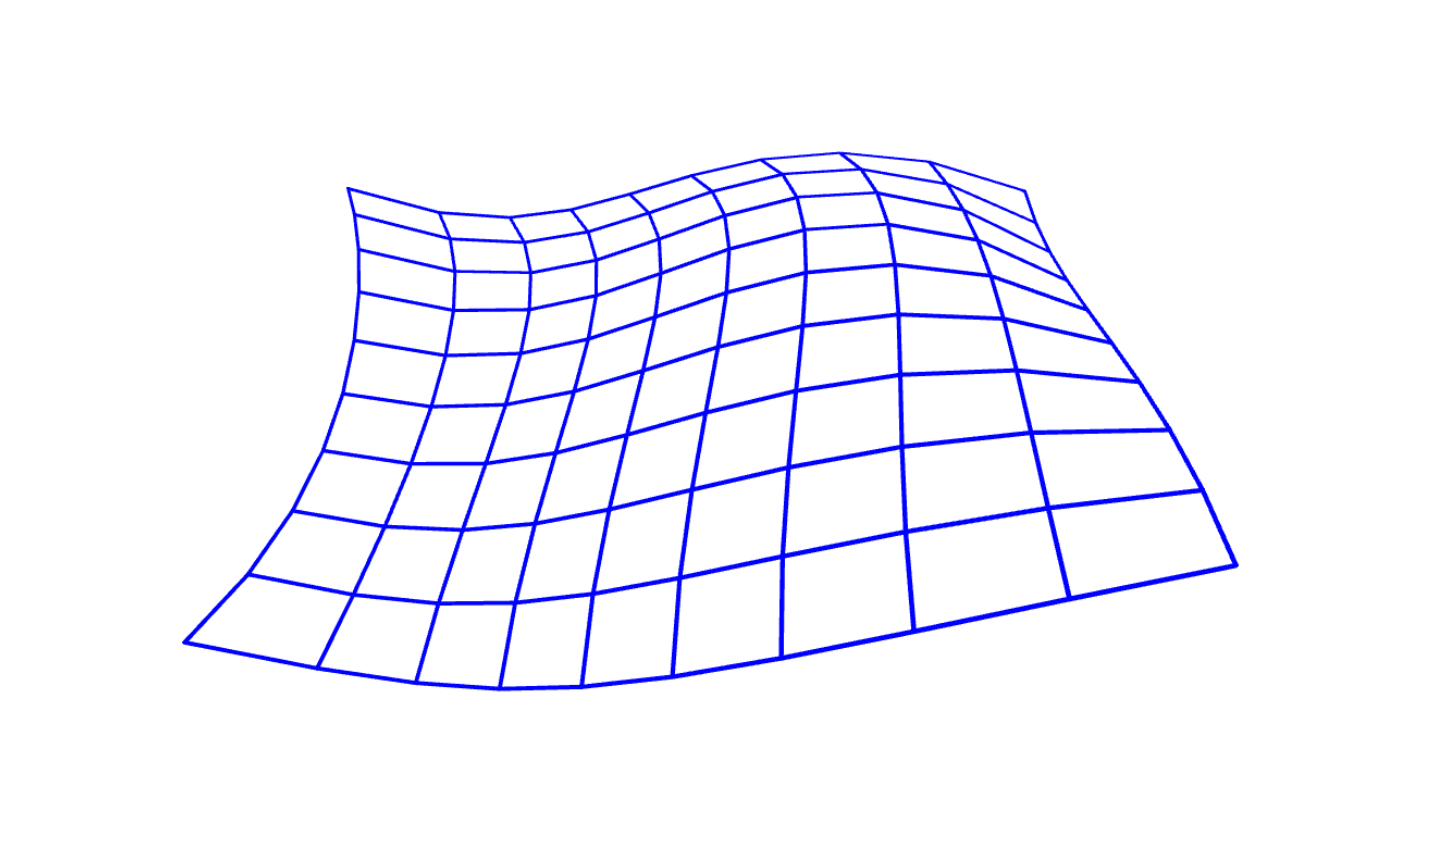
Bézier patch
A Bézier patch is defined as
$$ \underline{X}(u,v) = \sum_{i=0}^n \sum_{j=0}^m \underline{c}_{ij} B_i^n(u)B_j^m(v)$$ $$(u,v)\in[0,1]^2$$
The skatch below shows a bicubic Bézier patch, i.e. with $m=n=3$.
Warning: If you are not correctly seeing (or not seeing) the sketch below correctly, visit this link. Or this link to see and edit the source code.
p5js Implementation Notes
The code is written with the p5js library and was written using OOP methodology. In general, all 2d-3d versions and also Bézier patches consist of the following classes and methods:
class BezierCurve{
	function constructor(points: Array[Array[float]]){}
	function addControlPoint(x: float, y: float){}
	function deCastelJau(t: float){}
	function render(){
		//ConstructPoints.render() for all ConstructPoints
		//ConstructLines.render() for all ConstructLines
	}
}

class ConstructPoint{
	function constructor(x: float, y: float) {}
	function render() {}
	function hasInside(x: float, y: float) {}
}

class ConstructLine{
	function constructor(p1: ConstructPoint,p2: ConstructPoint) {}
	function render(){}
}
So to create a Bézier curve you need to instantiate a var bezierCurve = BezierCurve(points), then on the p5js draw() method call the curve’s render method like this: bezierCurve.render().
For the Bézier patches, however, an additional class has been created which instantiates multiple BezierCurve classes.
class BezierPatch{
	function constructor(points: Array[Array[float]]){}
	function addControlPoint(x: float, y: float){}
	function render(){}
}