Introduction
The aim of this project is to develop a cheaper alternative to the telemetry systems available on the market for mountain bikes.
Telemetry systems for mountain bikes monitor and acquire data on the position of the bike’s fork and shock absorber while riding. This data is crucial for off-road sports enthusiasts and professional athletes, as it provides valuable information for analysing and improving performance.
Currently, many telemetry systems, such as byb telemetry, use expensive linear potentiometers to accurately measure the position of the fork and shock absorber.
Other users on the internet have tried other ways to get a good result, for example a LiDar sensor, but the results were not too encouraging as they were too noisy.
Therefore, after careful evaluation, I have concluded that using a rotary encoder is a more cost-effective alternative.
The main reason for this choice is that rotary encoders are less expensive than linear potentiometers and still offer good position measurement accuracy. In addition, rotary encoders are generally more robust and less prone to damage than linear encoders, which can be more fragile and susceptible to failure in off-road environments.
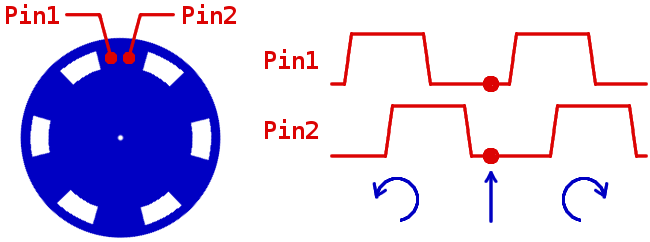
how a rotative encoder works
Encoders can sense movement in either direction, detecting holes or marks as they move through 2 positions. When the blue disc in the diagram below rotates clockwise, changes are first detected by pin 1 and then pin 2. When it rotates counterclockwise, pin 2 is the first to detect changes. This scheme is called ‘quadrature coding’ because the waveforms detected by the 2 pins are offset by 90 degrees.
|
(animation taken from questo sito)
pre - prototyping
Before proceeding with the prototyping of the fork sensor, I carried out a feasibility analysis to assess the feasibility of this project.
As a starting point, I selected a reliable rotary encoder: the LPD3806. This type of encoder offers a resolution of 600 PPR (pulses per revolution). Using a pulley with a diameter of 9.4 mm, a density of approximately 30 detections per millimetre of fork movement is achieved. This is because the encoder generates a quadrature signal that can be read on both the rising and falling edges. By exploiting both edges, we obtain a quadrupled resolution of the encoder, i.e. 24000 PPR (600 PPR * 4).
Calculating the number of possible observations per millimetre of fork movement, we obtain the following result:
$$ \frac{600 * 4}{\pi* 9.4} \approx 30 $$
For example, considering a 150 mm travel fork, there will be approximately 12190 detections (this value will be used in the code).
It is important to note that increasing the diameter of the pulley coupled to the encoder reduces the density of detections per millimetre of movement. Furthermore, the maximum response speed of the encoder must be taken into account, which determines the maximum linear speed that the fork can reach. In the case of the LPD3806, the maximum speed is:
$$ 2000 RPM = 2000/60 RPS = $$ $$ 2000* (\pi*9.4) /60 \frac{mm}{s} \approx 983 \frac{mm}{s} $$
Using a pulley with a smaller diameter will result in a lower maximum detectable linear speed.
With this initial information, I therefore started the prototyping process.
prototyping
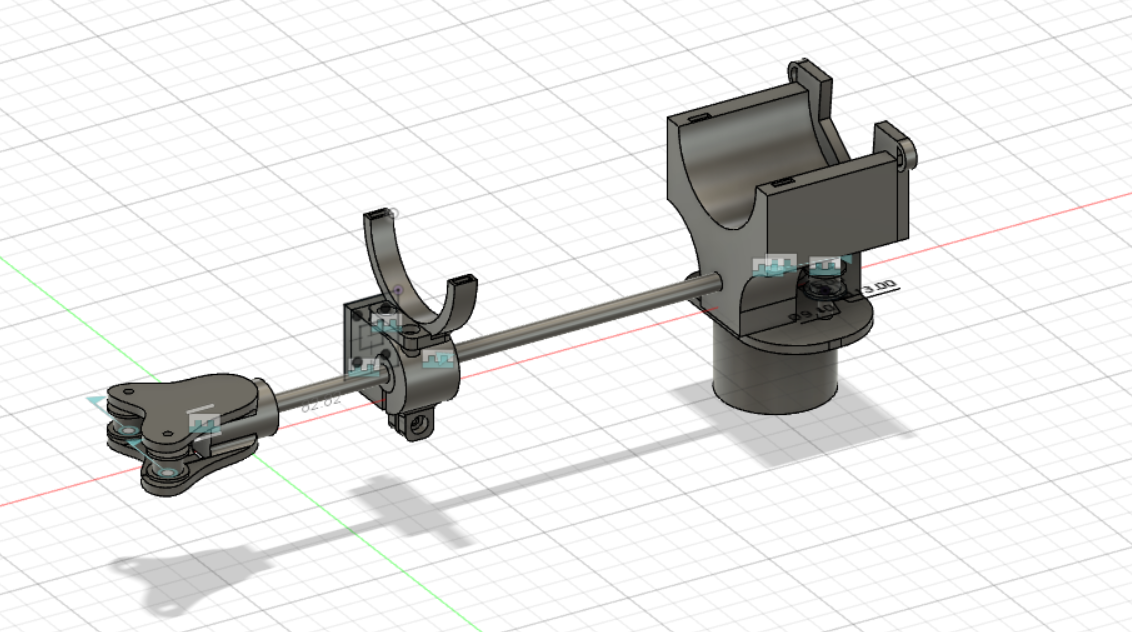
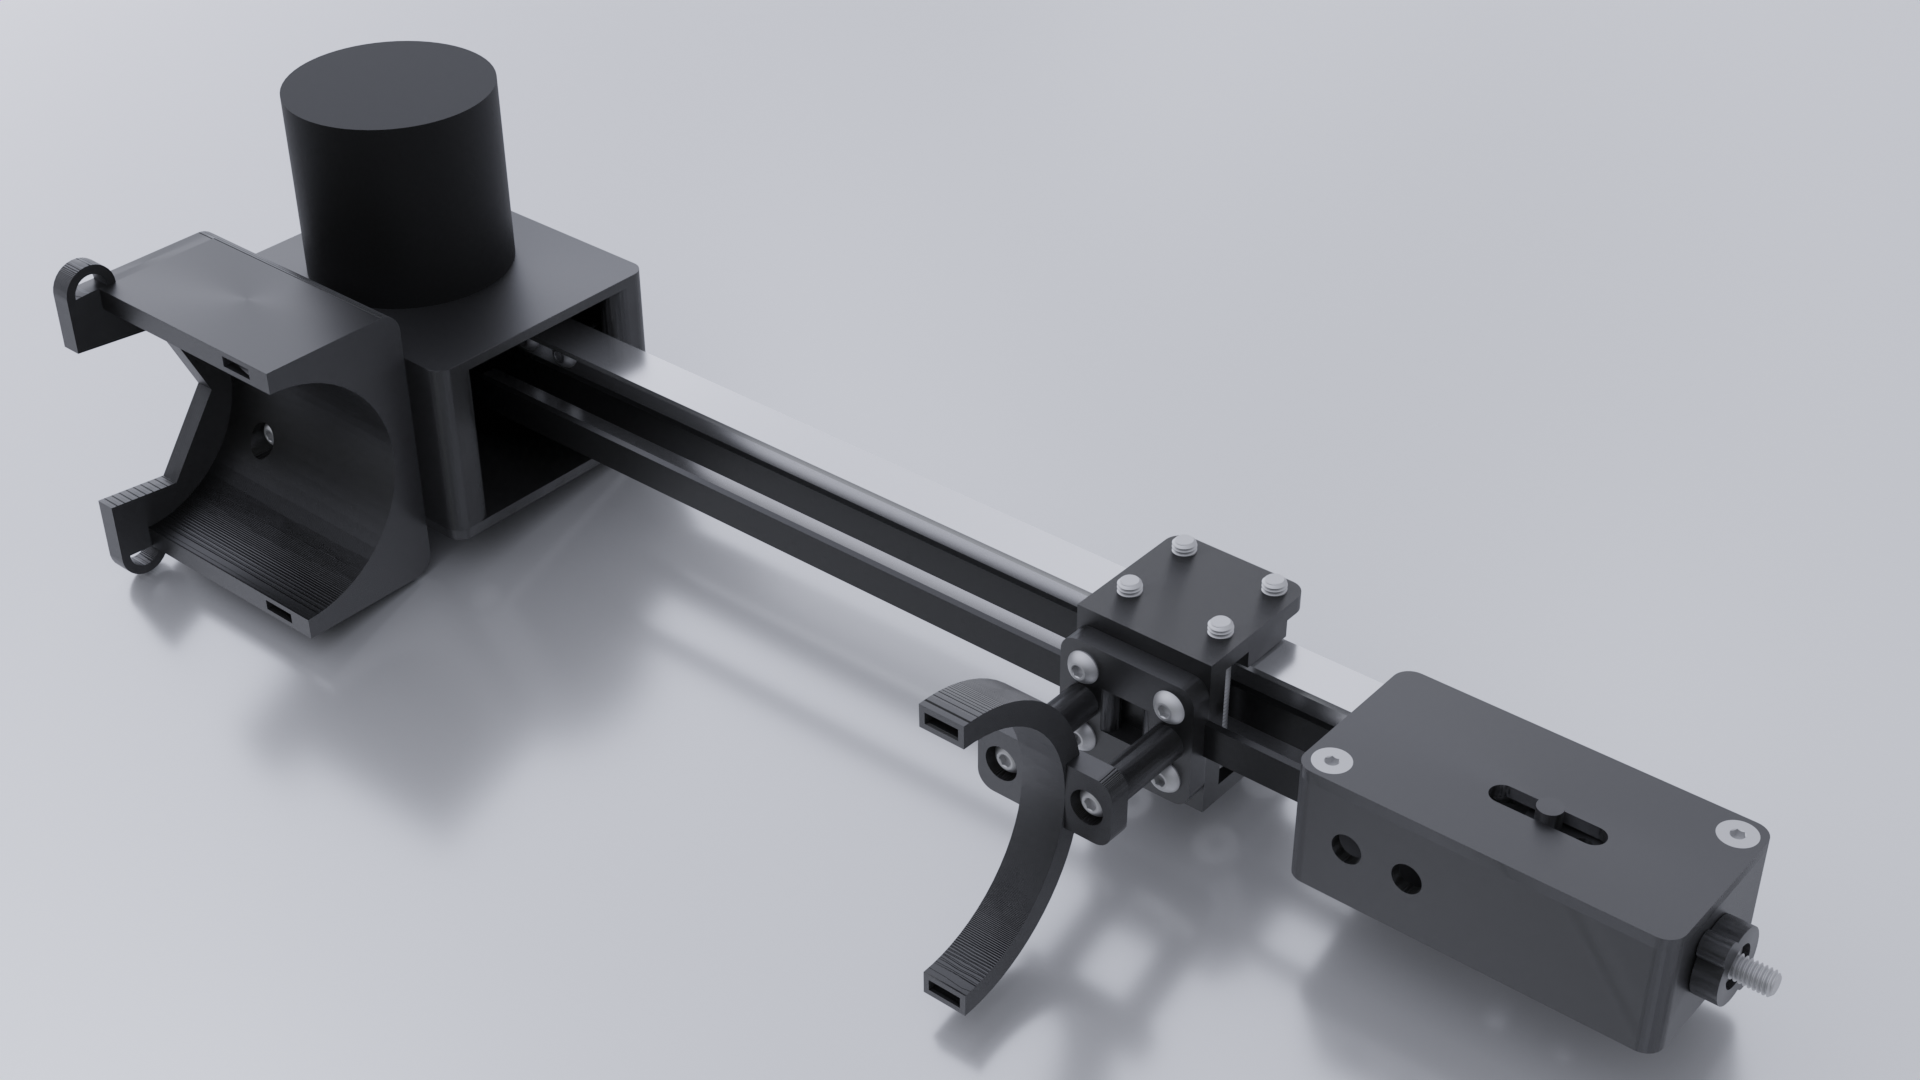
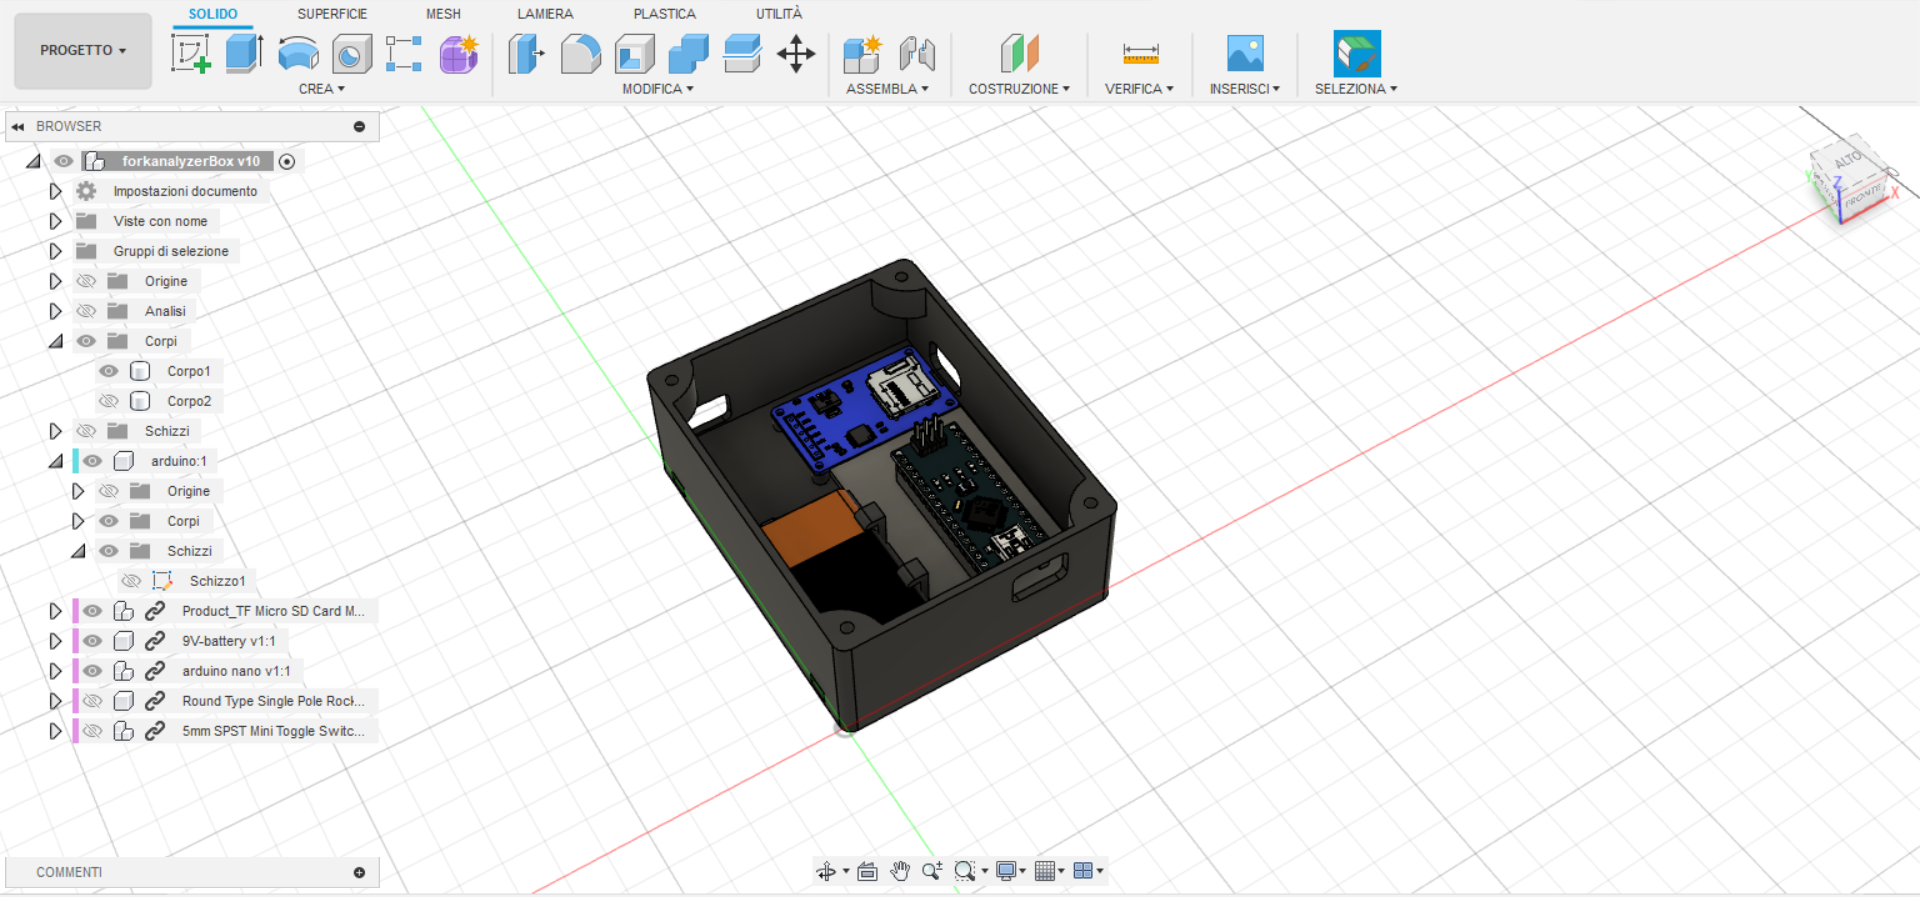
For the prototyping of the fork sensor, I used the fusion 360 software. After several iterations, I arrived at the following result:
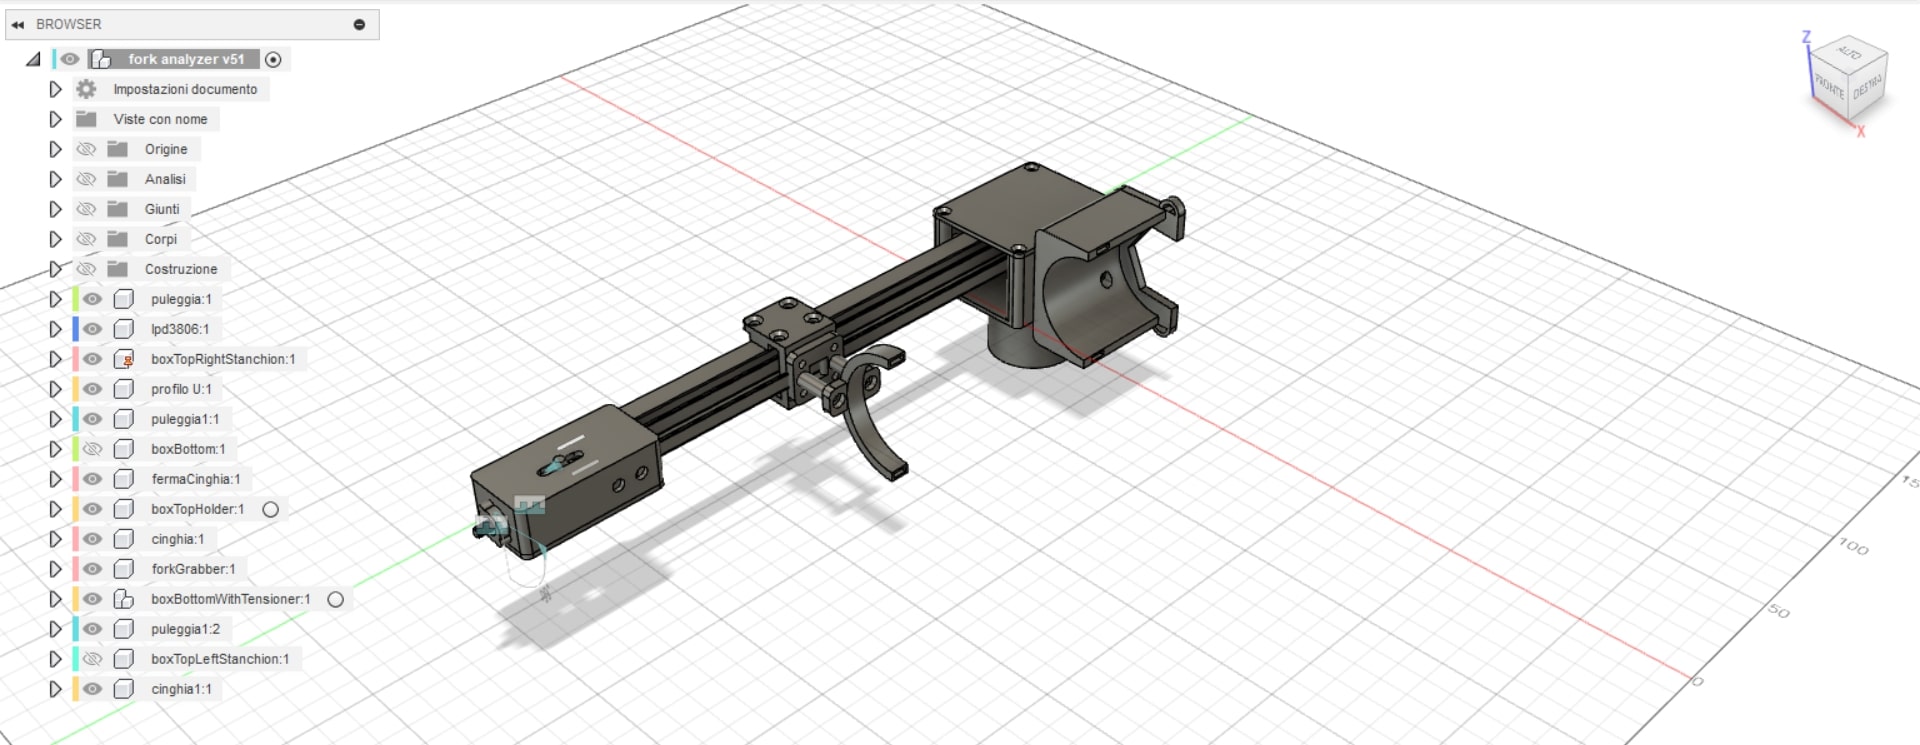
The fusion360 file is available on GitHub at this link. Using blender we can also show a concept of how it works once mounted on a fork.
For the design, I was inspired by the movement of the axes of a 3D printer and integrated a belt tensioning mechanism, typical of this type of printer.
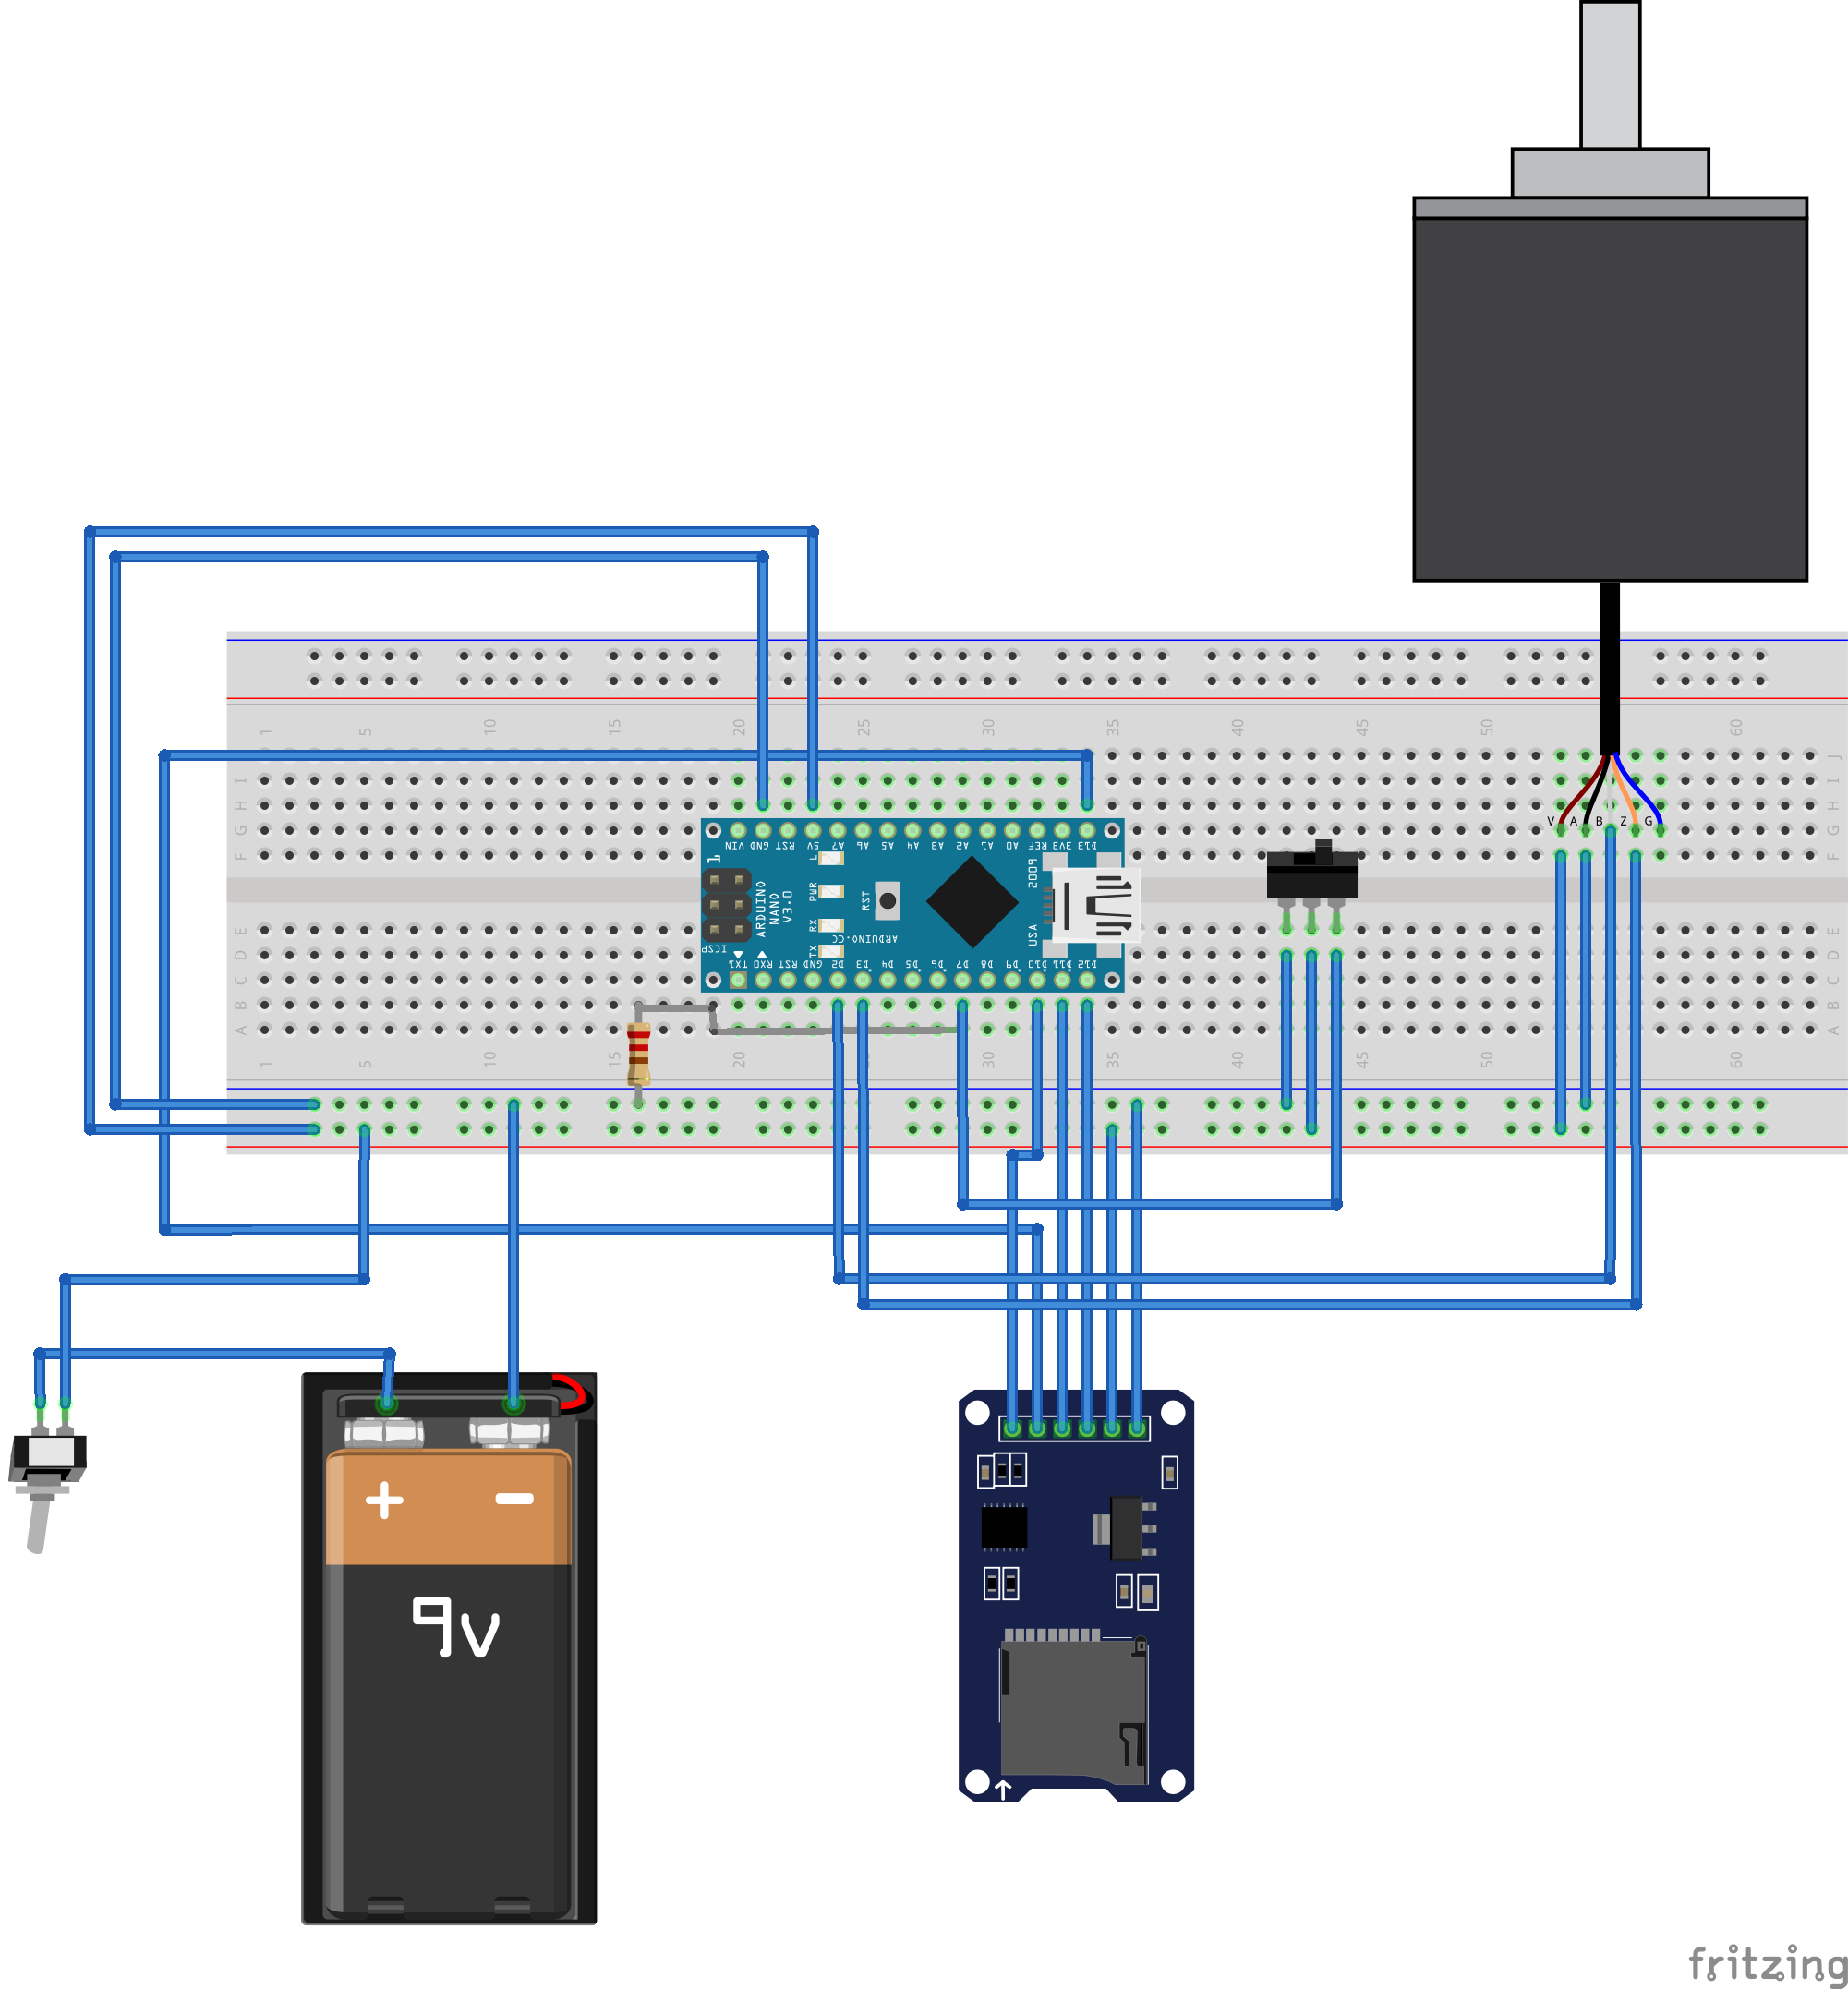
Subsequently, I used the Arduino Nano to create a working Proof of Concept (POC). Overall, the system consists of 2 switches, 1 SD module, 1 Arduino Nano, 1 9-volt battery and the LPD3806 encoder. Where:
- a switch is used to turn the system on
- The other switch enables the writing of the encoder position with the chosen encoding ([encoder_position,]) to the SD card. This switch must be activated before the start of the descent and switched off immediately afterwards.
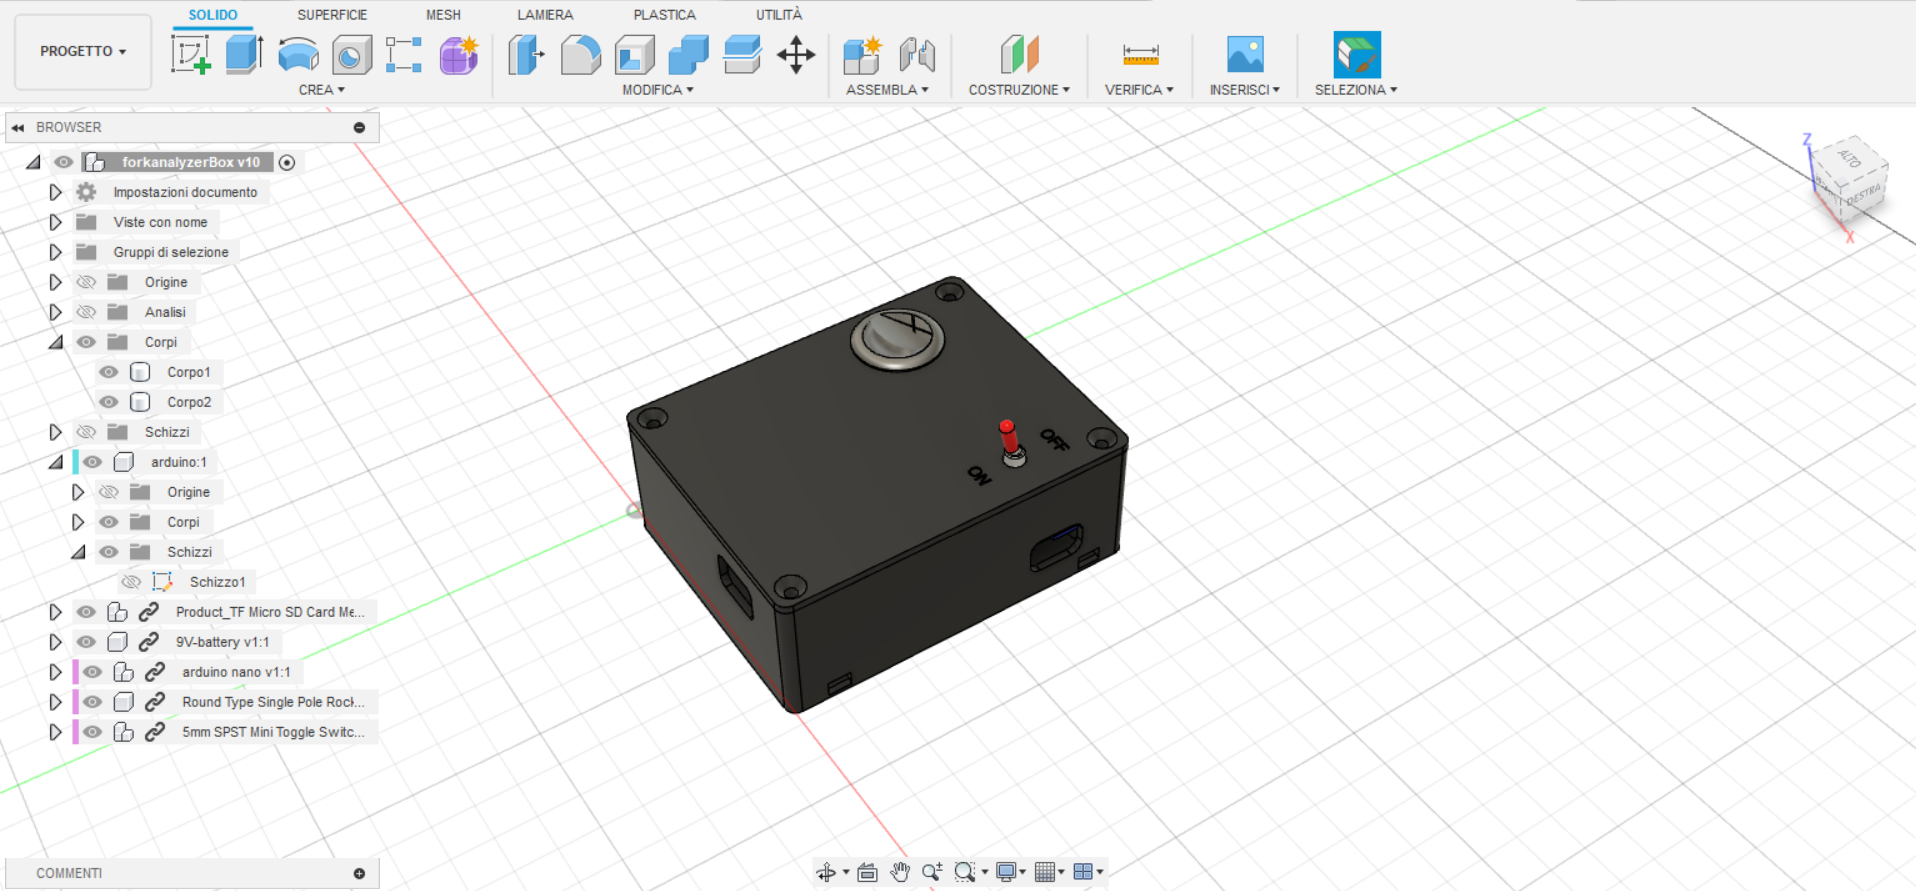
At this point, I also designed a capture box using Fusion 360.
stampa e codice
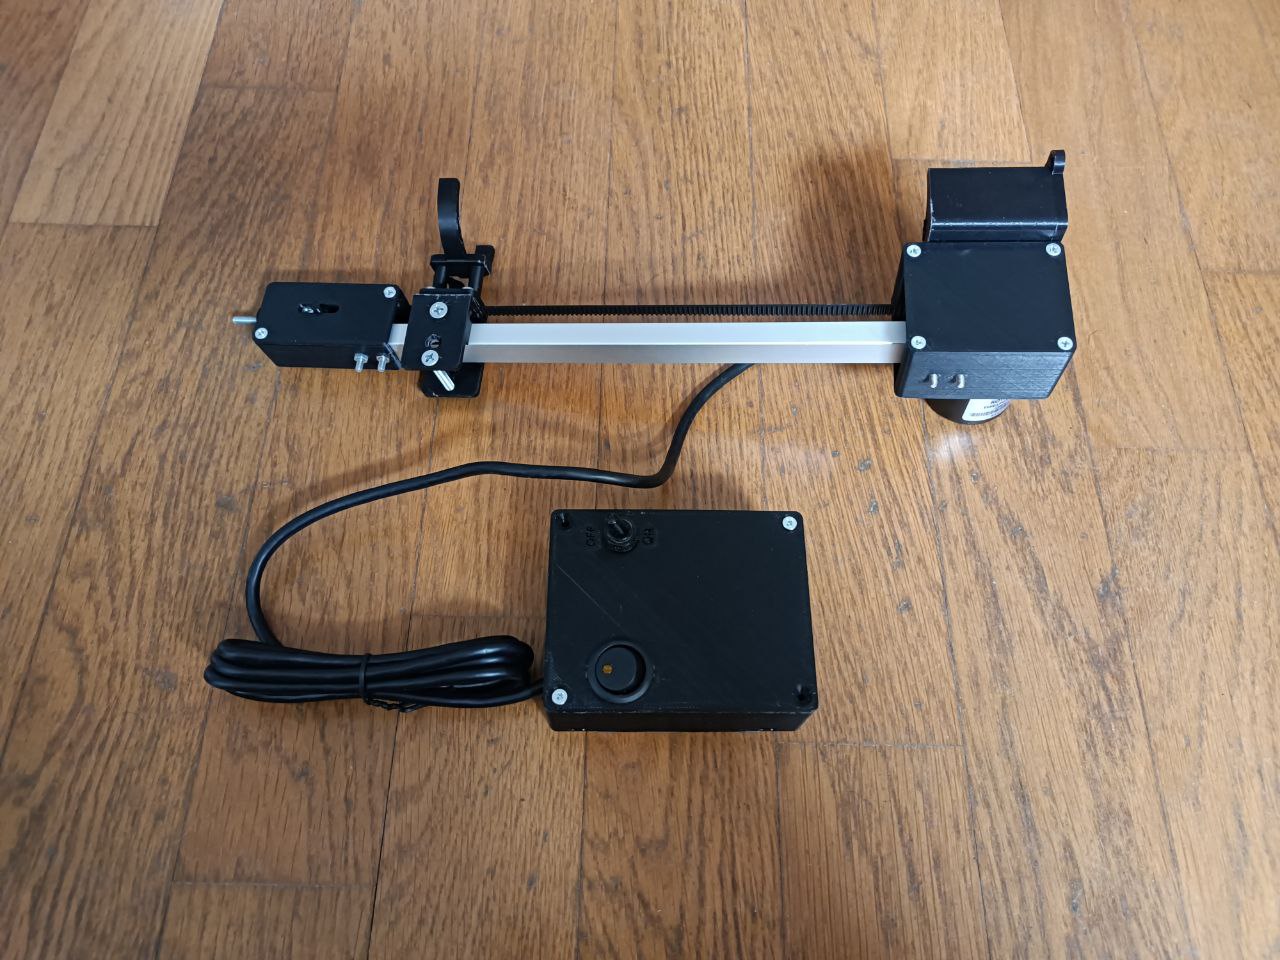
Once printed (and assembled) the sensor and acquisition box by soldering the components on a millefori
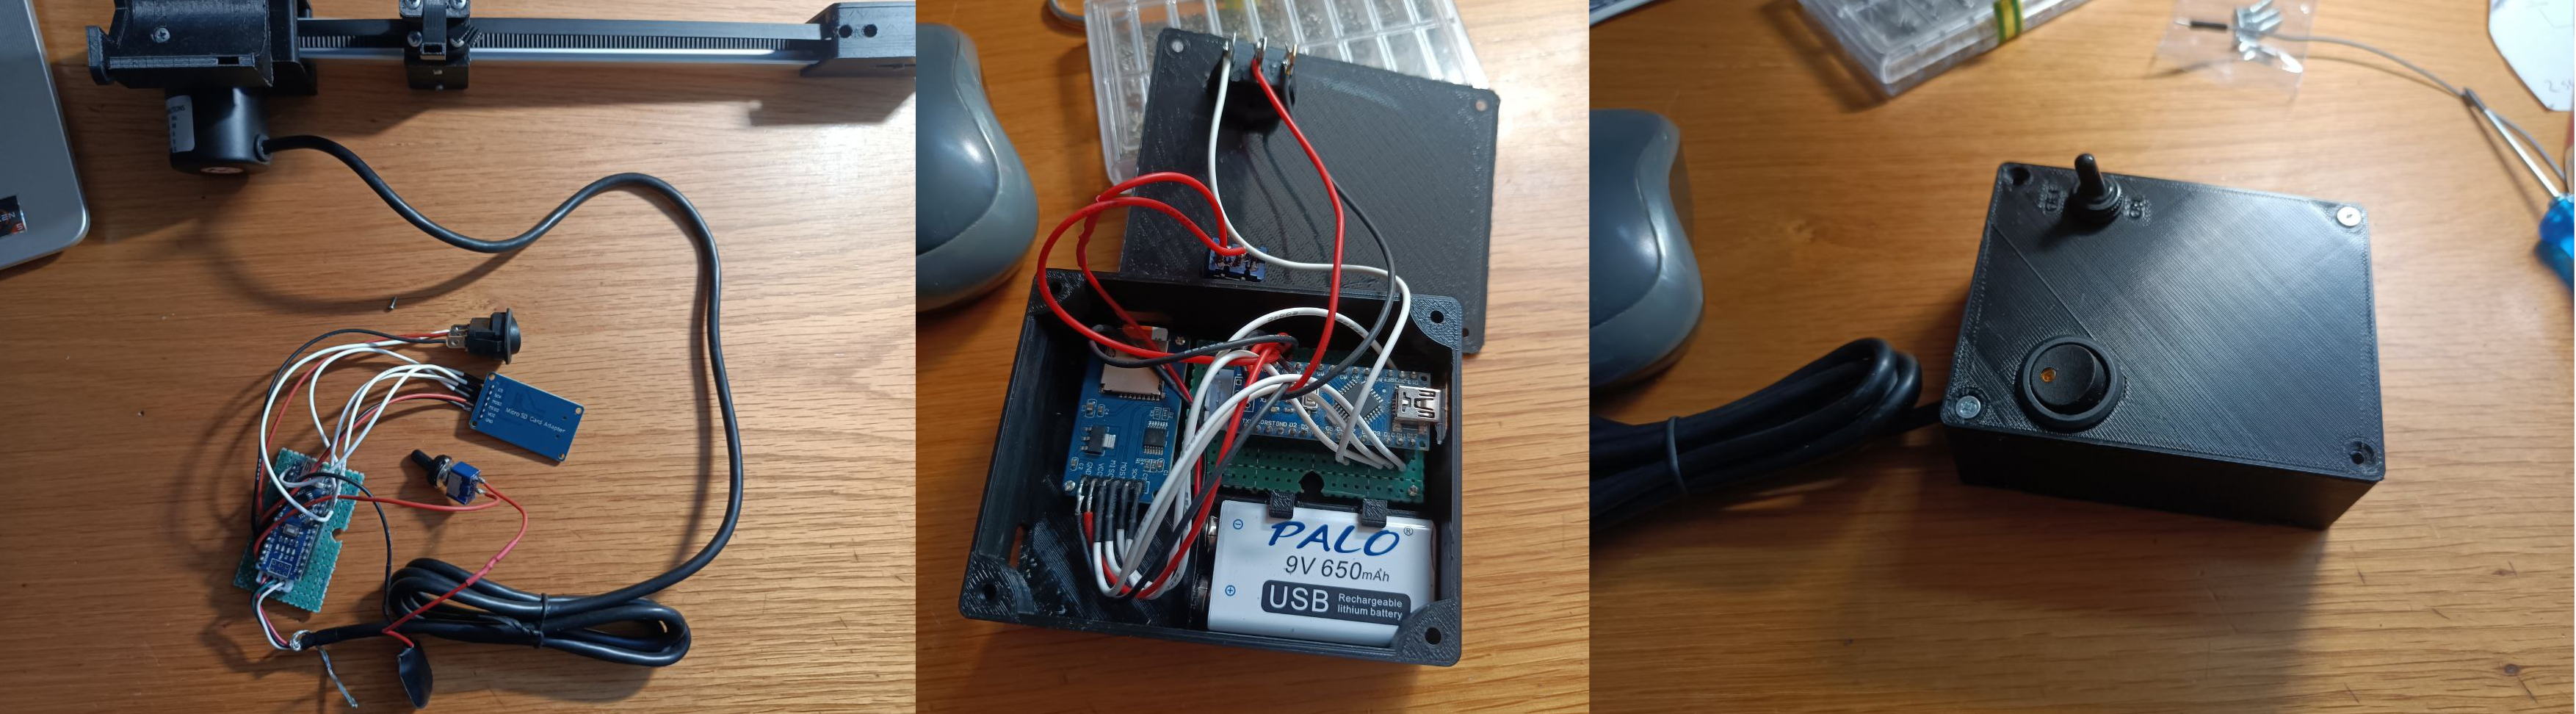
the whole thing looks like this:
Operation once mounted on the MTB is as follows:
The code instead is as follows. Note that the port manipulation technique was used to obtain a maximum speed in reading the encoder.
#include <SPI.h>
#include <SD.h>
#include <String.h>

#define encoderPinA 3
#define encoderPinB 2
#define buttonPin 7
#define SD_PIN 10

File logFile;
bool enableWriteToSD=false;

int newDirectoryName=0;
int newFileName=0;

bool startRecord;
volatile long encoderPosition=0;
volatile bool aStatePrev,bStatePrev,aState,bState;


void setup() {
  Serial.begin(9600);

  //setup rotary encoder
  DDRD &= ~((1 << encoderPinA) | (1 << encoderPinB));
  // Abilita i pull-up interni
  PORTD |= (1 << encoderPinA) | (1 << encoderPinB);
  attachInterrupt(digitalPinToInterrupt(encoderPinA),handleEncoderInterrupt,CHANGE);
  attachInterrupt(digitalPinToInterrupt(encoderPinB),handleEncoderInterrupt,CHANGE);

  //setup SD
  if(!SD.begin(SD_PIN)){ while(true); }

  while(SD.exists(String(newDirectoryName))){ newDirectoryName++; }
  if (SD.mkdir(String(newDirectoryName))){
    Serial.print("Created new directory: ");
    Serial.println(newDirectoryName);
  }


  //setup record button
  DDRD &= ~(1 << buttonPin);
  PORTD |= (1 << buttonPin);

  Serial.println("setup completed");
}

void loop() {
  startRecord=PIND&(1<<buttonPin);
  if(startRecord && !enableWriteToSD){
    logFile = SD.open(String(newDirectoryName) + "/" +  String(newFileName++) +".txt", FILE_WRITE);
    if (logFile) { Serial.println("Writing to "+ String(newFileName-1)); }
    enableWriteToSD=true;
  }
  else if(startRecord && enableWriteToSD) {
     logFile.print(String(encoderPosition)+",");
  }
  else if(!startRecord && enableWriteToSD){
    enableWriteToSD=false;
    logFile.close();
  }
}


void handleEncoderInterrupt(){
  // Leggi lo stato corrente dei segnali A e B
  aState = PIND & (1 << encoderPinA);
  bState = PIND & (1 << encoderPinB);

  // Verifica se il fronte di salita è avvenuto sul segnale A
  if (aState != aStatePrev) {
    aStatePrev = aState;
    // Verifica il cambiamento di direzione dell'encoder
    if (aStatePrev == bStatePrev) {
      encoderPosition--;
    } else {
      encoderPosition++;
    }
  }
  // Memorizza lo stato corrente dei segnali A e B per il prossimo interrupt
  bStatePrev = bState;
}
first tests and results
When the switch is activated, the code starts recording the encoder position and saves it in a log file in its folder. The log file contains the encoder position values separated by commas.
I have created a website in javascript that uses the Plotly JS library to display this data (GitHub link to site code). For example, the video I showed earlier produces a log file that can be opened in the site and generates this output:
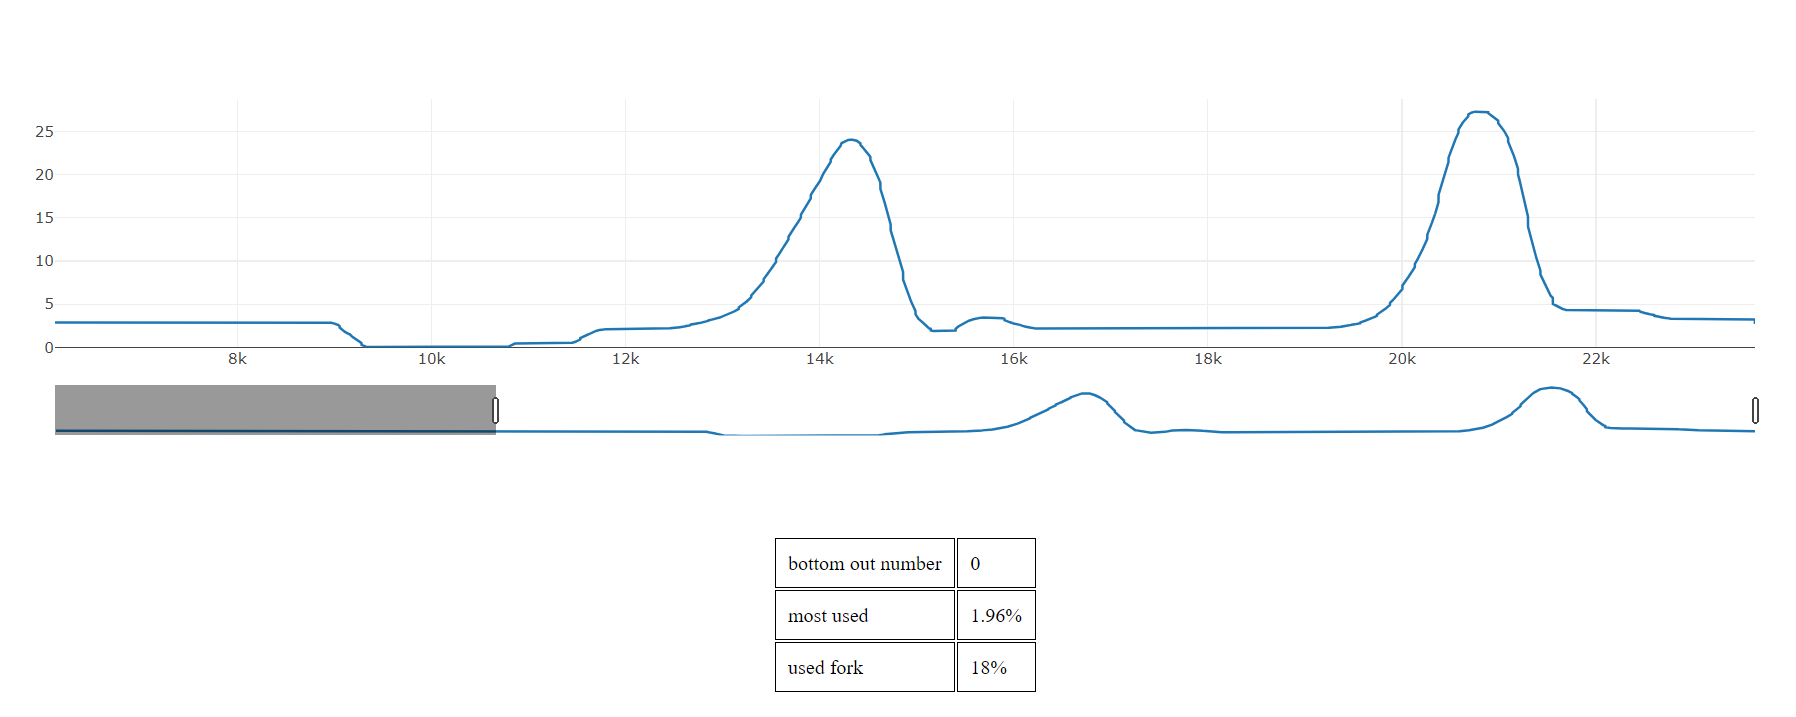
The scatter plot shows the sampling number on the abscissas and the fork compression in millimetres on the ordinates.
Below the graph there are also tabular data indicating the number of bottom-outs recorded (none here), the most frequent value of fork compression and the percentage of fork used (here over 26 mm on a 150 mm fork, i.e. around 18%).
telemetry display on screen
I have also created a python script (GitHub link to script) which is based on Pillow and cv2. This script allows you to insert the telemetry detected on a video, which for the video I showed earlier, produces an effect similar to this:
This script first creates 101 images of the rectangle with the percentage written inside (0% to 100%). It then puts these images together in a video where each image represents a value measured by the sensor.
field tests
When I tested the system on a real enduro descent, I encountered the first difficulties and restrictions of the hardware I used (especially the arduino). In fact, if the shocks are too fast, the pulse count coming from the encoder starts to ‘drift’ and become increasingly negative.
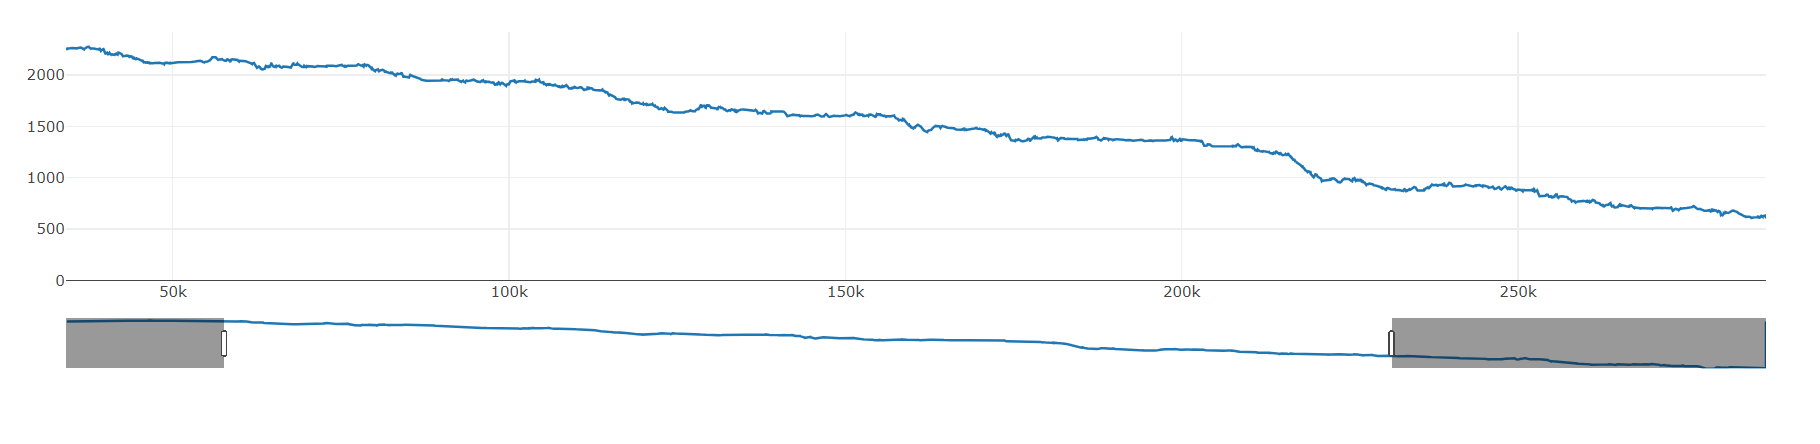
This is because the encoder frequency ranges from 0 to 20KHz. This implies that there is at least a 50 microsecond interval between one rising edge and another. Assuming that only the rising edges of signal A are read (thus lowering the accuracy estimate made earlier by a quarter), the arduino still cannot do all the necessary operations in this short time. In fact it should
- do a
digitalRead()on the signal pin B - write the position on the SD
In the next 2 I try to examine the code and explain why the arduino is not the correct hardware to proceed.
digitalRead
For example let’s look at how long a digitalRead() takes using port manipulation. We can for example take this arduino code that does a digitalRead() of encoderPinB and if it is HIGH then it adds 1 to encoderPosition, otherwise it decreases the variable by 1.
void handleEncoderInterrupt(){
  // Leggi lo stato corrente del segnale B
  PIND & (1 << encoderPinB) ? encoderPosition +=1 : encoderPosition -=1;
}
and decompile it C:\Users\luigi\AppData\Local\Temp\arduino_build_211859>"C:\Program Files (x86)\Arduino\hardware\tools\avr\bin\avr-objdump.exe" -S codice_test.ino.elf
ottenendo
a8:   4a 9b           sbis    0x09, 2 ; 9
aa:   0c c0           rjmp    .+24            ; 0xc4 <_Z22handleEncoderInterruptv+0x1c>
ac:   80 91 04 01     lds     r24, 0x0104     ; 0x800104 <__data_end>
b0:   90 91 05 01     lds     r25, 0x0105     ; 0x800105 <__data_end+0x1>
b4:   a0 91 06 01x     lds     r26, 0x0106     ; 0x800106 <__data_end+0x2>
b8:   b0 91 07 01     lds     r27, 0x0107     ; 0x800107 <__data_end+0x3>
bc:   01 96           adiw    r24, 0x01       ; 1
be:   a1 1d           adc     r26, r1
c0:   b1 1d           adc     r27, r1
c2:   0b c0           rjmp    .+22            ; 0xda <_Z22handleEncoderInterruptv+0x32>
c4:   80 91 04 01     lds     r24, 0x0104     ; 0x800104 <__data_end>
c8:   90 91 05 01     lds     r25, 0x0105     ; 0x800105 <__data_end+0x1>
cc:   a0 91 06 01     lds     r26, 0x0106     ; 0x800106 <__data_end+0x2>
d0:   b0 91 07 01     lds     r27, 0x0107     ; 0x800107 <__data_end+0x3>
d4:   01 97           sbiw    r24, 0x01       ; 1
d6:   a1 09           sbc     r26, r1
d8:   b1 09           sbc     r27, r1
da:   80 93 04 01     sts     0x0104, r24     ; 0x800104 <__data_end>
de:   90 93 05 01     sts     0x0105, r25     ; 0x800105 <__data_end+0x1>
e2:   a0 93 06 01     sts     0x0106, r26     ; 0x800106 <__data_end+0x2>
e6:   b0 93 07 01     sts     0x0107, r27     ; 0x800107 <__data_end+0x3>
ea:   08 95           ret
In particular, the instructions that do the digital readout of encoderPinB are the 2nd to 6th, i.e. the 4 instructions that use lds (Load direct from SRAM).
From the ATmega328 datasheet (page 283) we can see that these instructions take exactly 2 clock cycles.

So being a 16Mhz microcontroller (1 clock cycle takes 1/16,000,000th of a second, or 62.5 nanoseconds), then those 4 instructions take 8 cycles * 62.5 ns/cycle = 500 ns.
From this analysis, it can be deduced that digitalRead() is not the bottleneck in the code.
write to SD
Instead, let’s look at how long a write to the SD takes. To get a more or less approximate number, we can for example print out the number of milliseconds before and after the position is written to memory.
Serial.println(millis());
logFile.print(String(encoderPosition)+",");
Serial.println(millis());
And we can see that indeed the bottleneck is in this call, which can take up to 200 milliseconds. Of course, this time also depends on the SD used.
future developments
- use a microcontroller with several cores, e.g. an esp32 where one core takes care of reading the encoder signal and another takes care of sampling (which can then be done constantly e.g. 1000 times per second) and writing the encoder position to the SD.
- use a Bluetooth module to communicate data to an android application, also in real time.
- add a GPS module so that you can have in the analysis panel not only the position of the fork metre by metre but also the position of the rider along the descent.
- sensor redesign. The first design I did was top-down (also because it was the first time I had used fusion360 and also the first time I had really created something functional) and with box shapes (not structurally strong) and a lot can be improved. For example, using a linear guide can reduce the complexity of the sensor (and also the weight) but also the degrees of freedom of the system. Below is a possible v2 design using a 6mm linear guide.