graphTheory-Visualizer
The project was done to visualize the operations that can be done on a graph, such as BFS, DFS, Kruskal, and Dijkstra.
The goal is to have a real time update of the various operations, so that if the graph changes while an ‘operation is being performed on it, the result of the operation also changes.
The project is active on GitHub pages and a demo can be accessed from this link: https://giggiox.github.io/graphTheory-Visualizer/
The GUI looks like this:

and allows:
- create new vertex (on-screen
vertexbutton) - create an arc between two vertices (on-screen
edgebutton) by clicking first on the first vertex and then on the second - remove an arc between two vertices by clicking on it
- set the graph as weighted and/or directed (switches present on the screen)
- see the adjacency list as a dropdown. Notice how if the graph changes for example if you remove an arc, the list changes in real time
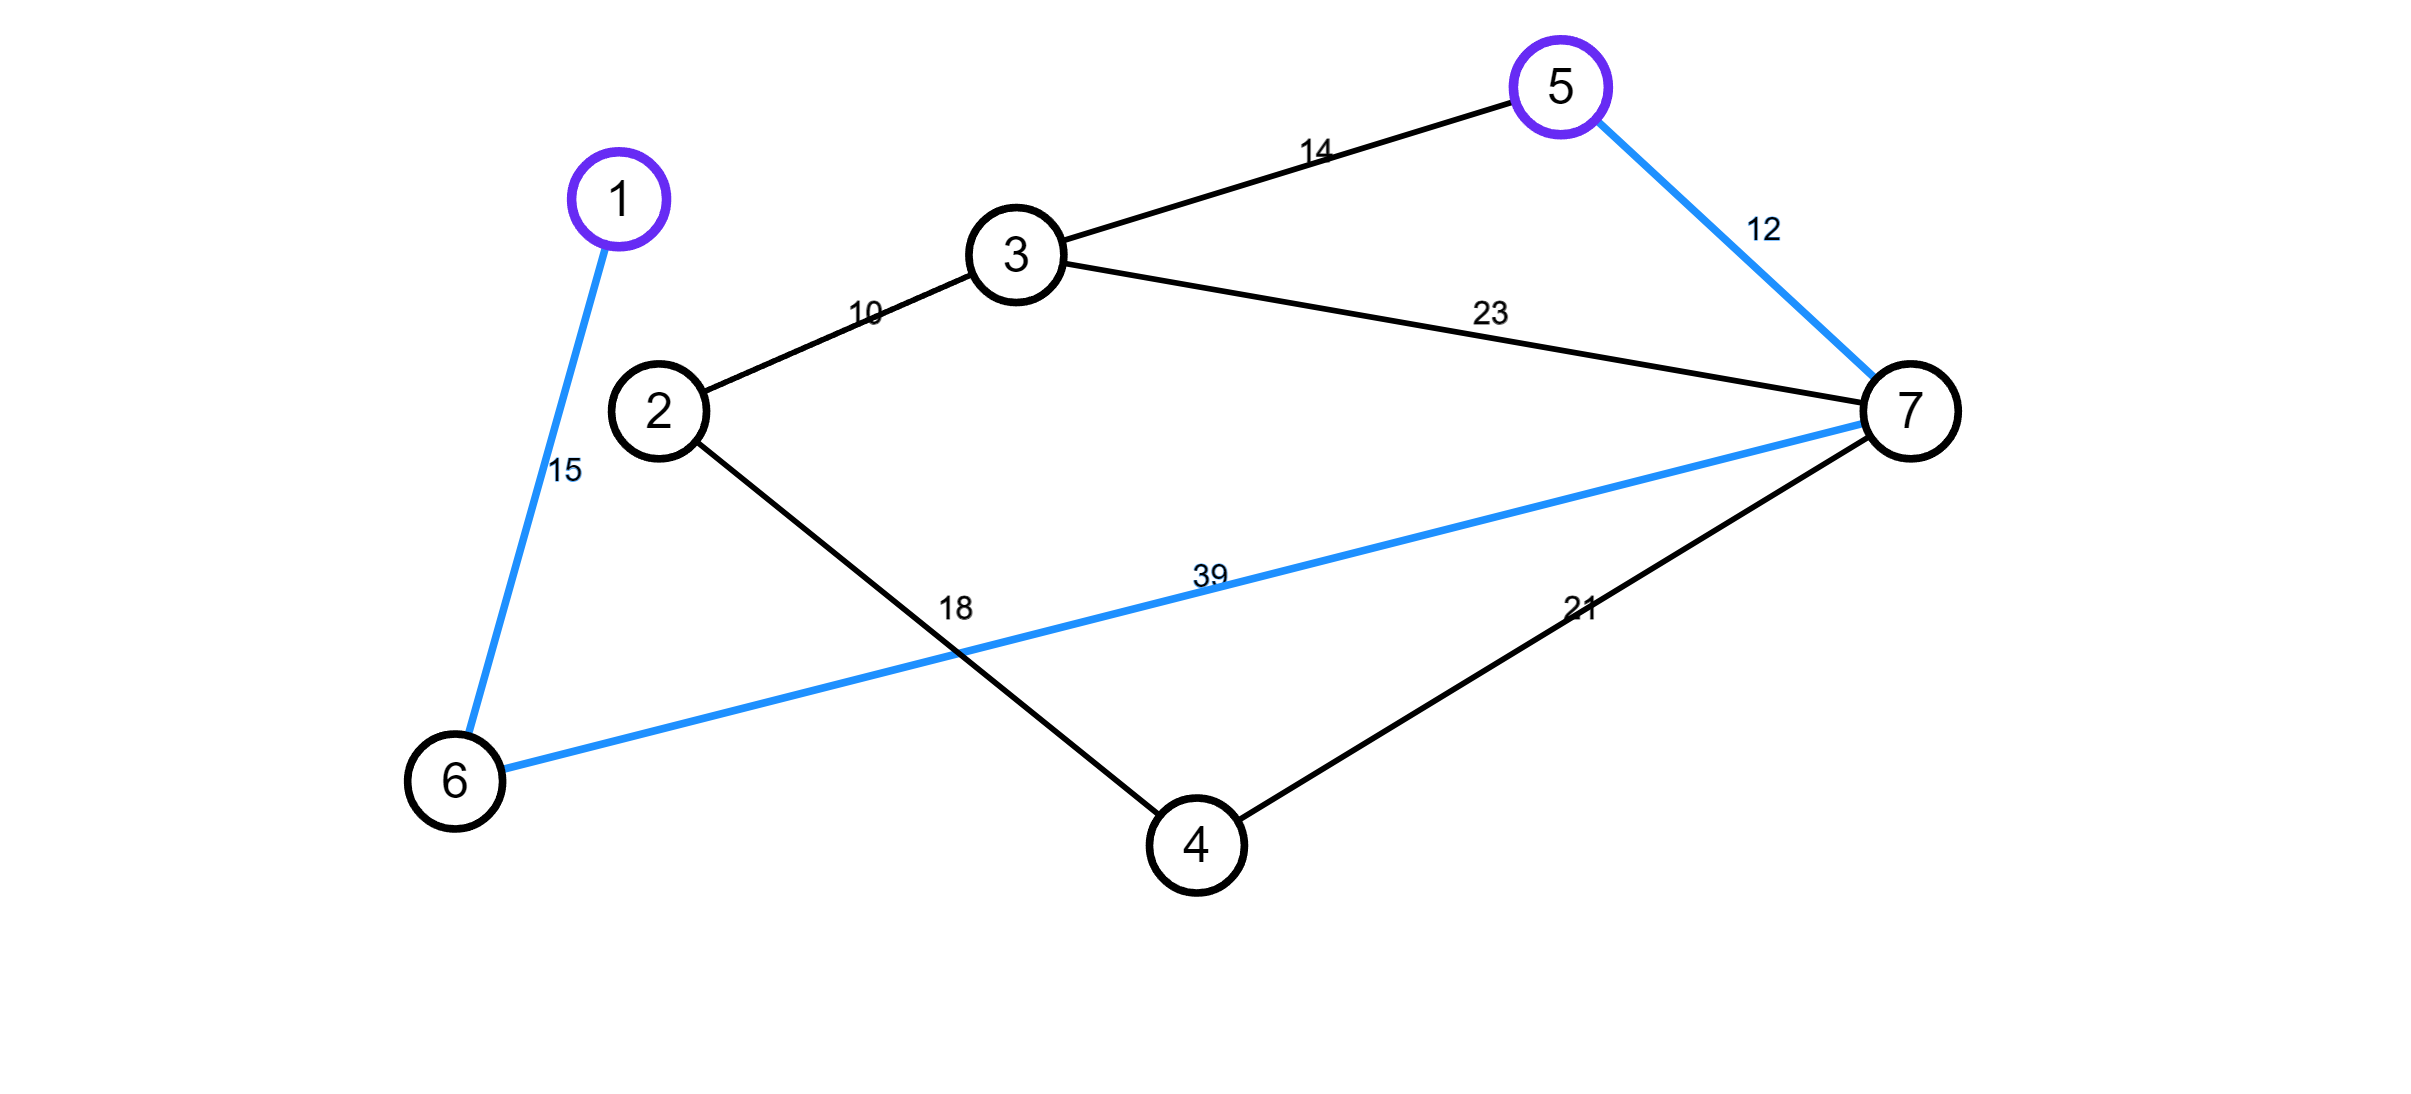
- visualize the possible operations on a graph. It is necessary to choose the operation with the dropdown present in the navbar and then start the visualization. Note how even in this case, for example if we choose to display the Dijkstra algorithm and in the process we change the graph by moving the vertices, then the output of the algorithm also changes in real time. The output of an algorithm is displayed on the graph by highlighting vertices and arcs in blue.
examples
depth-first search (DFS):
dijkstra shortest path between 2 vertices:

kruskal minimum spanning tree:

Project done using p5js and TypeScript.