
Lately, I’ve been exploring GPU programming with CUDA by implementing the K-Means clustering algorithm. Below is a overview of my approach and some insights into the CUDA implementation that achieved a +100x speedup 🚀.
Note: every time you will read the term speedup in this post, it will be measured against to the sequential version.
You can find the source code of everyhting that is going to be discussed at this public GitHub repository.
Table Of Contents
K-Means Algorithm
K-Means is an unsupervised classification algorithm that groups objects into k clusters based on their features. The algorithm consists of two main steps repeated until convergence:
- Assignment Step: Assign each point to the nearest centroid.
- Update Step: Update each centroid to be the mean of all points assigned to it.
A simplified pseudo-code:
initialize centroids randomly.
for iteration = 1 to MAX_ITER:
	a. for each point:
		assign the point to its nearest centroid.
	b. for each centroid:
		update its position to be the mean of all assigned points.
Formally, we have $(x_1,…,x_n), x_i \in \mathbb{R}^d$ (data points). The k-means algorithm builds $k$ groups (or clusters) $S = \set{S_1,…,S_k}$ where the sum of the distances of the data points (SSE or Sum of Squared Error) to its centroid is minimized. So the algorithm minimizes: $$SSE = \sum_{i=1}^{k} \sum_{x_j \in S_i} dist(x_j, \mu_i)^2$$
$$\frac{\partial SSE}{\partial \mu_i} = 0 \implies \mu_i^{(t+1)} = \frac{1}{|S_i^{(t)}|} \sum_{x_j \in S_i^{(t)}} x_j$$
So the solution is to take each group element average as a new centroid (as per step (b)). The relationship holds because in the SSE formula we used euclidean distance as a distance function, different centroid updates can be found by changing the distance metric.
If you did not had the opportunity to look at how K-means works, i think the visualization below will give you a good grasp:
Note: Although the centroids are initialized randomly here, this isn’t the optimal approach. If the starting centroids are poorly chosen, the final clusters may be incorrect. A better method is kmeans++.
Parallelizing K-Means with CUDA
The most time-consuming part of K-Means is the assignment step (a), where we compute the distance from each point to every centroid. This part is a (what so called) embarrassingly parallel problem and can be accelerated with CUDA. The update step (b) is a bit more involved because it requires careful handling to avoid race conditions when updating centroids.
CUDA Kernel presentation
Here’s the core CUDA code that handles both the assignment and update steps:
__global__ void centroidAssignAndUpdate(float *dataPoints_dev,  float *centroids_dev, float *newCentroids_dev, int *clusterCardinality_dev,int*clusterLabel_dev, int N){
    const int index = threadIdx.x + blockIdx.x * blockDim.x;
    if (index >= N) return;
    int localIndex = threadIdx.x;
    __shared__ float newCentroids_shared[2 * K];
    __shared__ int clusterCardinality_shared[K];

    for (int i = localIndex; i < 2*K; i += blockDim.x) {
        newCentroids_shared[i] = 0.0;
        if (i < K) {
            clusterCardinality_shared[i] = 0;
        }
    }

    __syncthreads();
    float minDistance = INFINITY;
    int clusterLabel = 0;
    for (int j = 0; j < K; ++j) {
        float distance = distanceMetric(dataPoints_dev[index * 2], dataPoints_dev[index * 2 + 1],
                                        centroids_dev[j * 2], centroids_dev[j * 2 + 1]);
        if (distance < minDistance){
            minDistance = distance;
            clusterLabel = j;
        }
    }
    clusterLabel_dev[index] = clusterLabel;
    atomicAdd(&(newCentroids_shared[clusterLabel*2]), dataPoints_dev[index*2]);
    atomicAdd(&(newCentroids_shared[clusterLabel*2 + 1]), dataPoints_dev[index*2 + 1]);
    atomicAdd(&(clusterCardinality_shared[clusterLabel]),1);
    __syncthreads();

    for (int i = localIndex; i < K; i+= blockDim.x) {
        atomicAdd(&(newCentroids_dev[i*2]), newCentroids_shared[i*2]);
        atomicAdd(&(newCentroids_dev[i*2+1]), newCentroids_shared[i*2+1]);
        atomicAdd(&(clusterCardinality_dev[i]), clusterCardinality_shared[i]);
    }
}
If you are not already comfortable with CUDA code, the code above might be difficult to understand at first 😓. Do not worry though! I will try to explain at my best what that code does. To understand how it works, you have to first understand how a nvidia GPU works.
Understanding the GPU Execution Model
A kernel is the function that runs on the GPU. When you launch a kernel, it is executed by a grid of blocks, where each block contains many threads. Threads within the same block can communicate using fast shared memory, which is essential for many parallel algorithms.
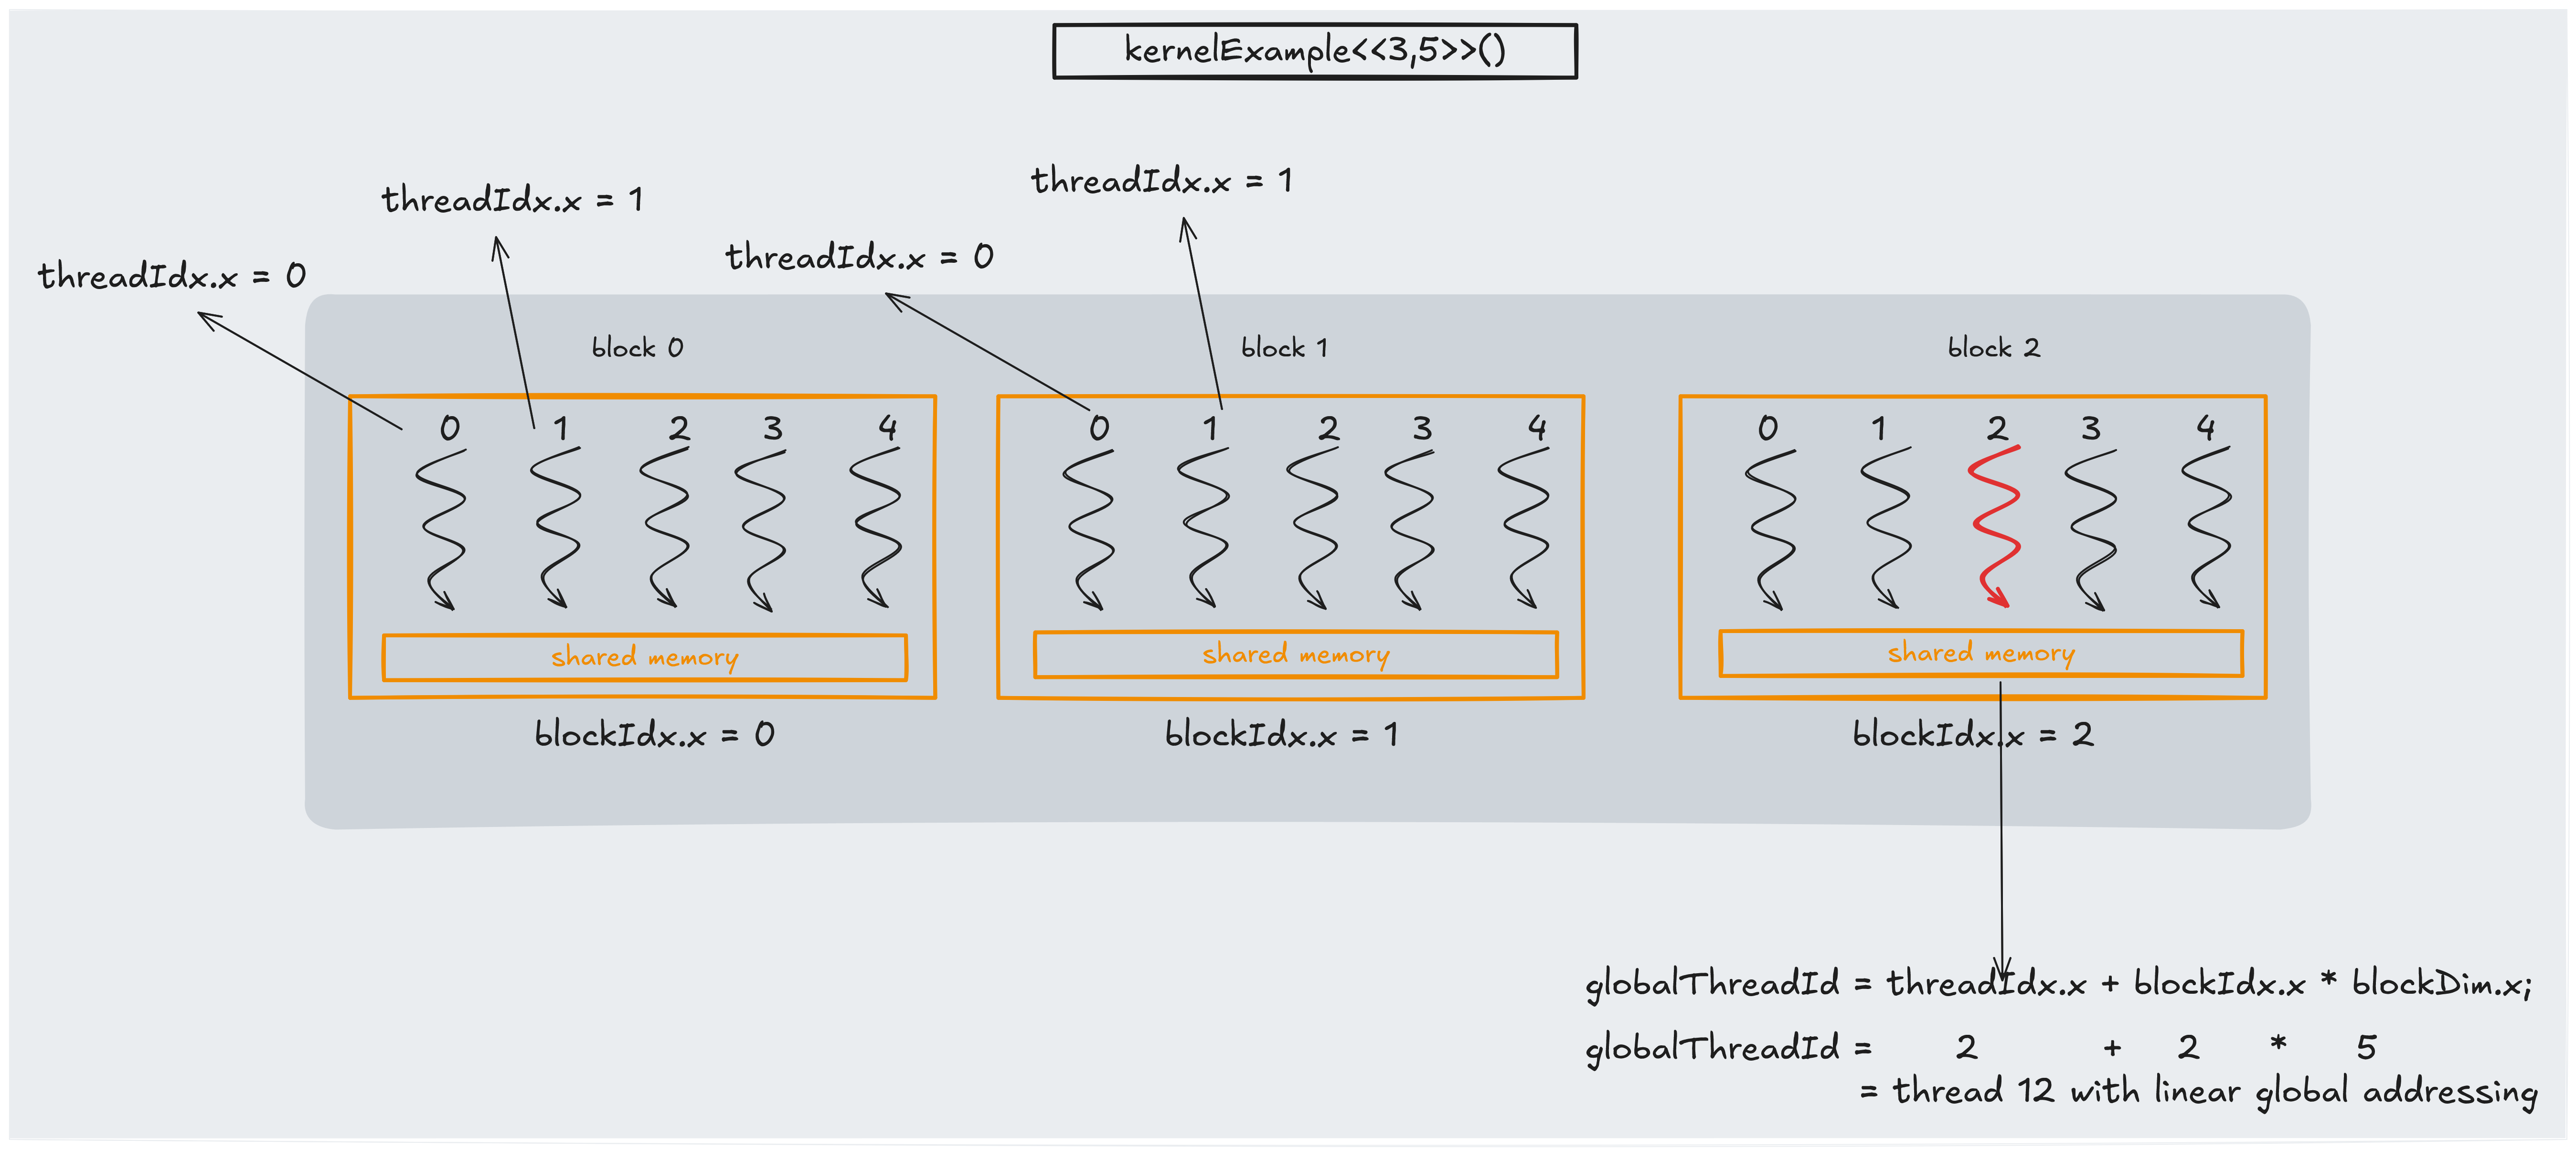
The key parts are:
- Grid: A grid is a collection of blocks that execute your kernel. The grid can be one- (like in the picture above), two-, or three-dimensional, depending on the problem.
- Block: Each block is a group of threads that run concurrently and can share data via shared memory. Blocks are independent of each other.
- Thread: A thread is the smallest unit of execution. Each thread has access to a set of built-in variables that provide its unique identifiers, like
threadIdx.x(thread’s index within its block),blockIdx.x( block’s index within the grid) andblockDim.x(total number of threads in each block).
CUDA Kernel explanation
Let’s say our dataset is composed of 4 datapoints and we are performing $2$-means:
$$D = \set{x0,x1,x2,x3}$$ where $$x0=(0,0), x1=(0,1)$$ $$x2=(1,0), x3 = (1,1)$$
And after the random centroids initialization (first step of the k-means algorithm) we find that
$$c0 = (0.5,0), c1 = (0.5,1)$$
We organize the data in a Structure of Arrays (SoA) layout because it stores similar types of data contiguously in memory. This arrangement improves cache utilization and enables more efficient vectorized and parallel memory access, which is particularly advantageous for GPU processing compared to the traditional Array of Structures (AoS) layout.
$$\text{points_dev } = [x0, x1, x2, x3]$$
$$= [\overbrace{0, 0}^{x0}, \overbrace{0, 1}^{x1}, \overbrace{1,0}^{x2}, \overbrace{1, 1}^{x3}]$$
And the same thing for the centroids:
$$\text{centroids_dev } = [c0, c1]$$ $$= [\overbrace{0.5, 0}^{c0}, \overbrace{0.5, 1}^{c1}]$$
Calling the kernel
The kernel you have seen in the previous section performs one iteration of the k-means algorithm. The kernel must be able to spawn at least one thread for each points, this will allow parallelism. In the example above, it must spawn at least 4 threads. Knowing that the number of threads per block is a fixed number (up to $1024$ for GPU’s with compute capability 2.x and higher), we must play with the number of blocks.
In the example above if we fix the number of thread per block to 2, we must set the number of blocks to 2. We will call
$$\text{kernelExample«2,2»(…)}$$
The kernel code can be broke down into 4 parts:
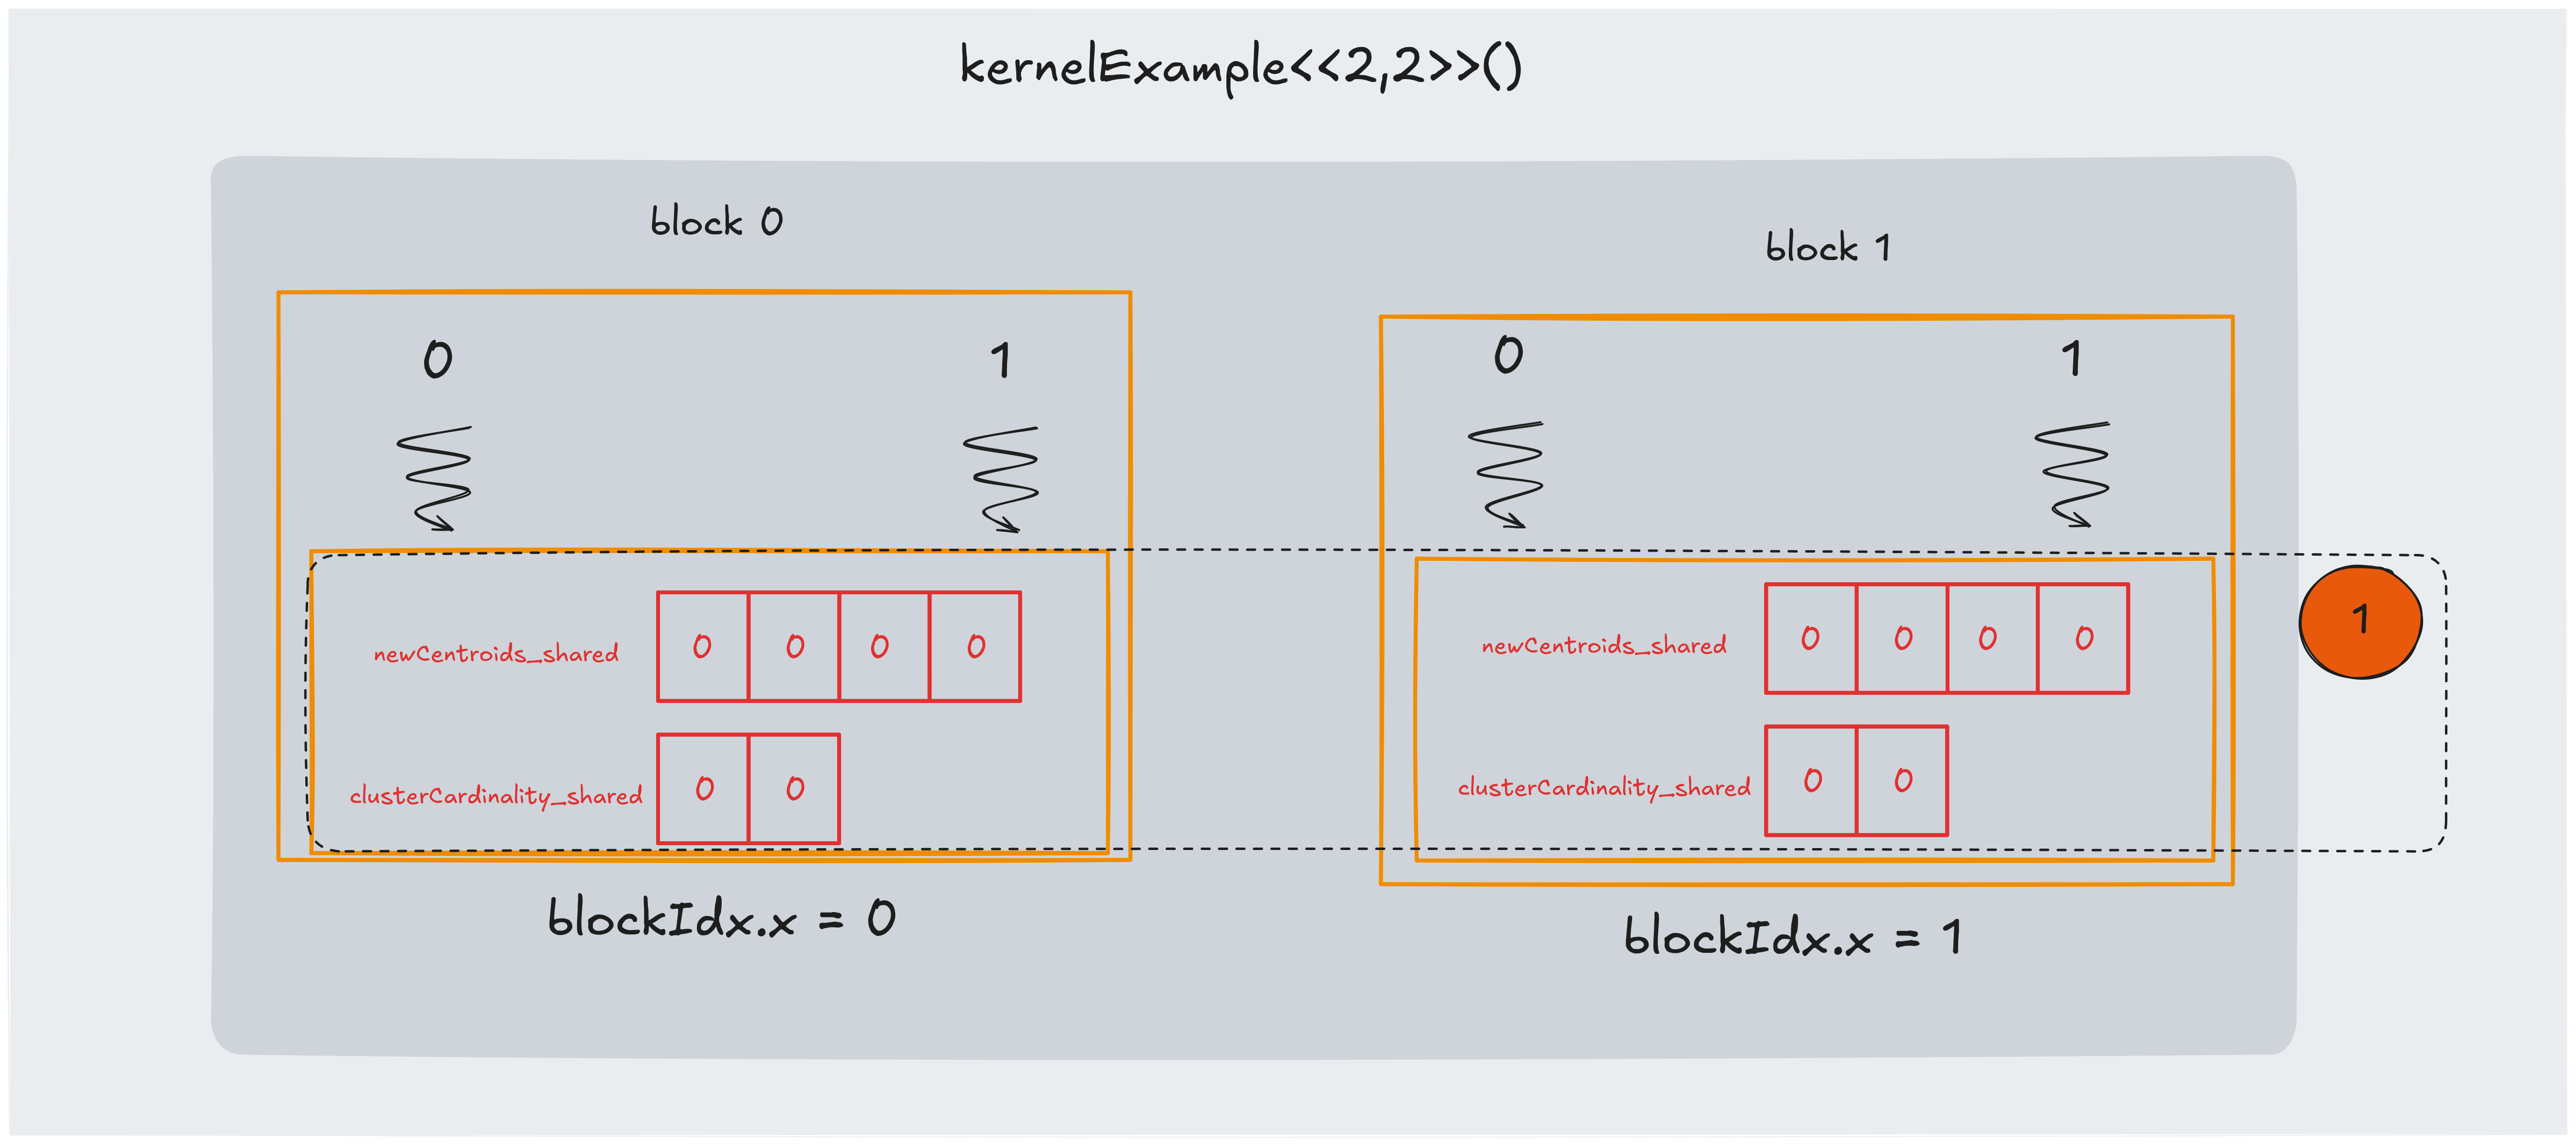
Part 1: initializing shared memory
In this part we ensure each block has it’s own copy of the centroids coordinates and that they are initialized to zero. We must also have a block shared cluster cardinality vector to save the cardinality of each cluster.
The code to do that is the following:
__shared__ float newCentroids_shared[2*K];
__shared__ int clusterCardinality_shared[K];

for(int i = threadIdx.x; i < 2*K; i += blockDim.x) {
	newCentroids_shared[i] = 0.0;
	if (i < K) {
		clusterCardinality_shared[i] = 0;
	}
}
In CUDA, __shared__ variables have block-level scope, and there is no built-in function (like memset) to initialize shared memory.
Therefore, you must manually zero out these arrays using a loop.
The code above ensures that every element of the two shared arrays is set to zero before any further computation.
It uses a strided loop so that if the number of threads per block (i.e., blockDim.x) is less than the total number of elements to initialize (2*K), each thread will initialize multiple elements.
An alternative approach
If you know that the number of threads per block is at least $2*K$, you could simplify the initialization using conditional statements:
__shared__ float newCentroids_shared[2*K];
__shared__ int clusterCardinality_shared[K];

if (threadIdx.x < 2*K){
	newCentroids_shared[threadIdx.x] = 0.0;
}
if (threadIdx.x < K) {
	clusterCardinality_shared[i] = 0;
}
Caveat: Using this alternative method restricts you to a maximum of $K = blockDim.x / 2$ clusters. For example, if you use blocks of $1024$ threads, this approach limits you to at most $512$ clusters. The first method with the loop is more general, as it will correctly initialize the arrays even when $\text{THREAD_PER_BLOCK} < 2*K$.
The use of static shared memory
Both static variables are being statically allocated (the amount to be allocated is known at compile time). Shared memory is not infinite, and depending on the GPU model can be 48KB=49152bytes or 16KB=16384bytes.
To be sure we are not allocating too much data, it is possible to clalculate the maximum number of centroids we can have:
Since the kernel centroidAssignAndUpdate has 2 shared arrays
-
newCentroids_shared[2*K], which occupies $K*2* \text{ sizeof(float)}=K*8 \text{ bytes}$ -
clusterCardinality_shared[K], which occupies $K*\text{ sizeof(int)}=K*4 \text{ bytes}$
So in total with $K=100$ we are occupying $1200$ bytes of shared memory per block.
We can then calculate what is the maximum number of $K$ we can have. If we know the size of GPU shared memory is 48kb=49152bytes, then the maximum $K$ can be calculated as follows:
$$(2K\times 4) + (K\times 4) \leq 49152$$ $$12K \leq 49152$$ $$ K \leq 4096$$
So the maximum number of centroids we can have with this implementation is $4096$.
To check the block shared memory size, you can use this code:
cudaDeviceProp prop;
cudaGetDeviceProperties(&prop, 0);
std::cout << "Shared Memory per Block: " << prop.sharedMemPerBlock << " bytes" << std::endl;
We can think about one optimization where we save cluster labels in a short int instead of a int, because we see that by doing so we get that the maximum number of $K$ is: $$(2K\times 4) + (K\times 2) \leq 49152$$ $$K \leq 4915$$ While $4915$ still fits in a short int type.
After initializing the shared memory, a barrier is necessary:
__syncthreads();
This synchronization ensures that every thread in the block has finished initializing the shared arrays before any thread begins subsequent computations. Without this barrier, some threads might access shared memory that hasn’t been fully initialized, leading to race conditions and incorrect results.
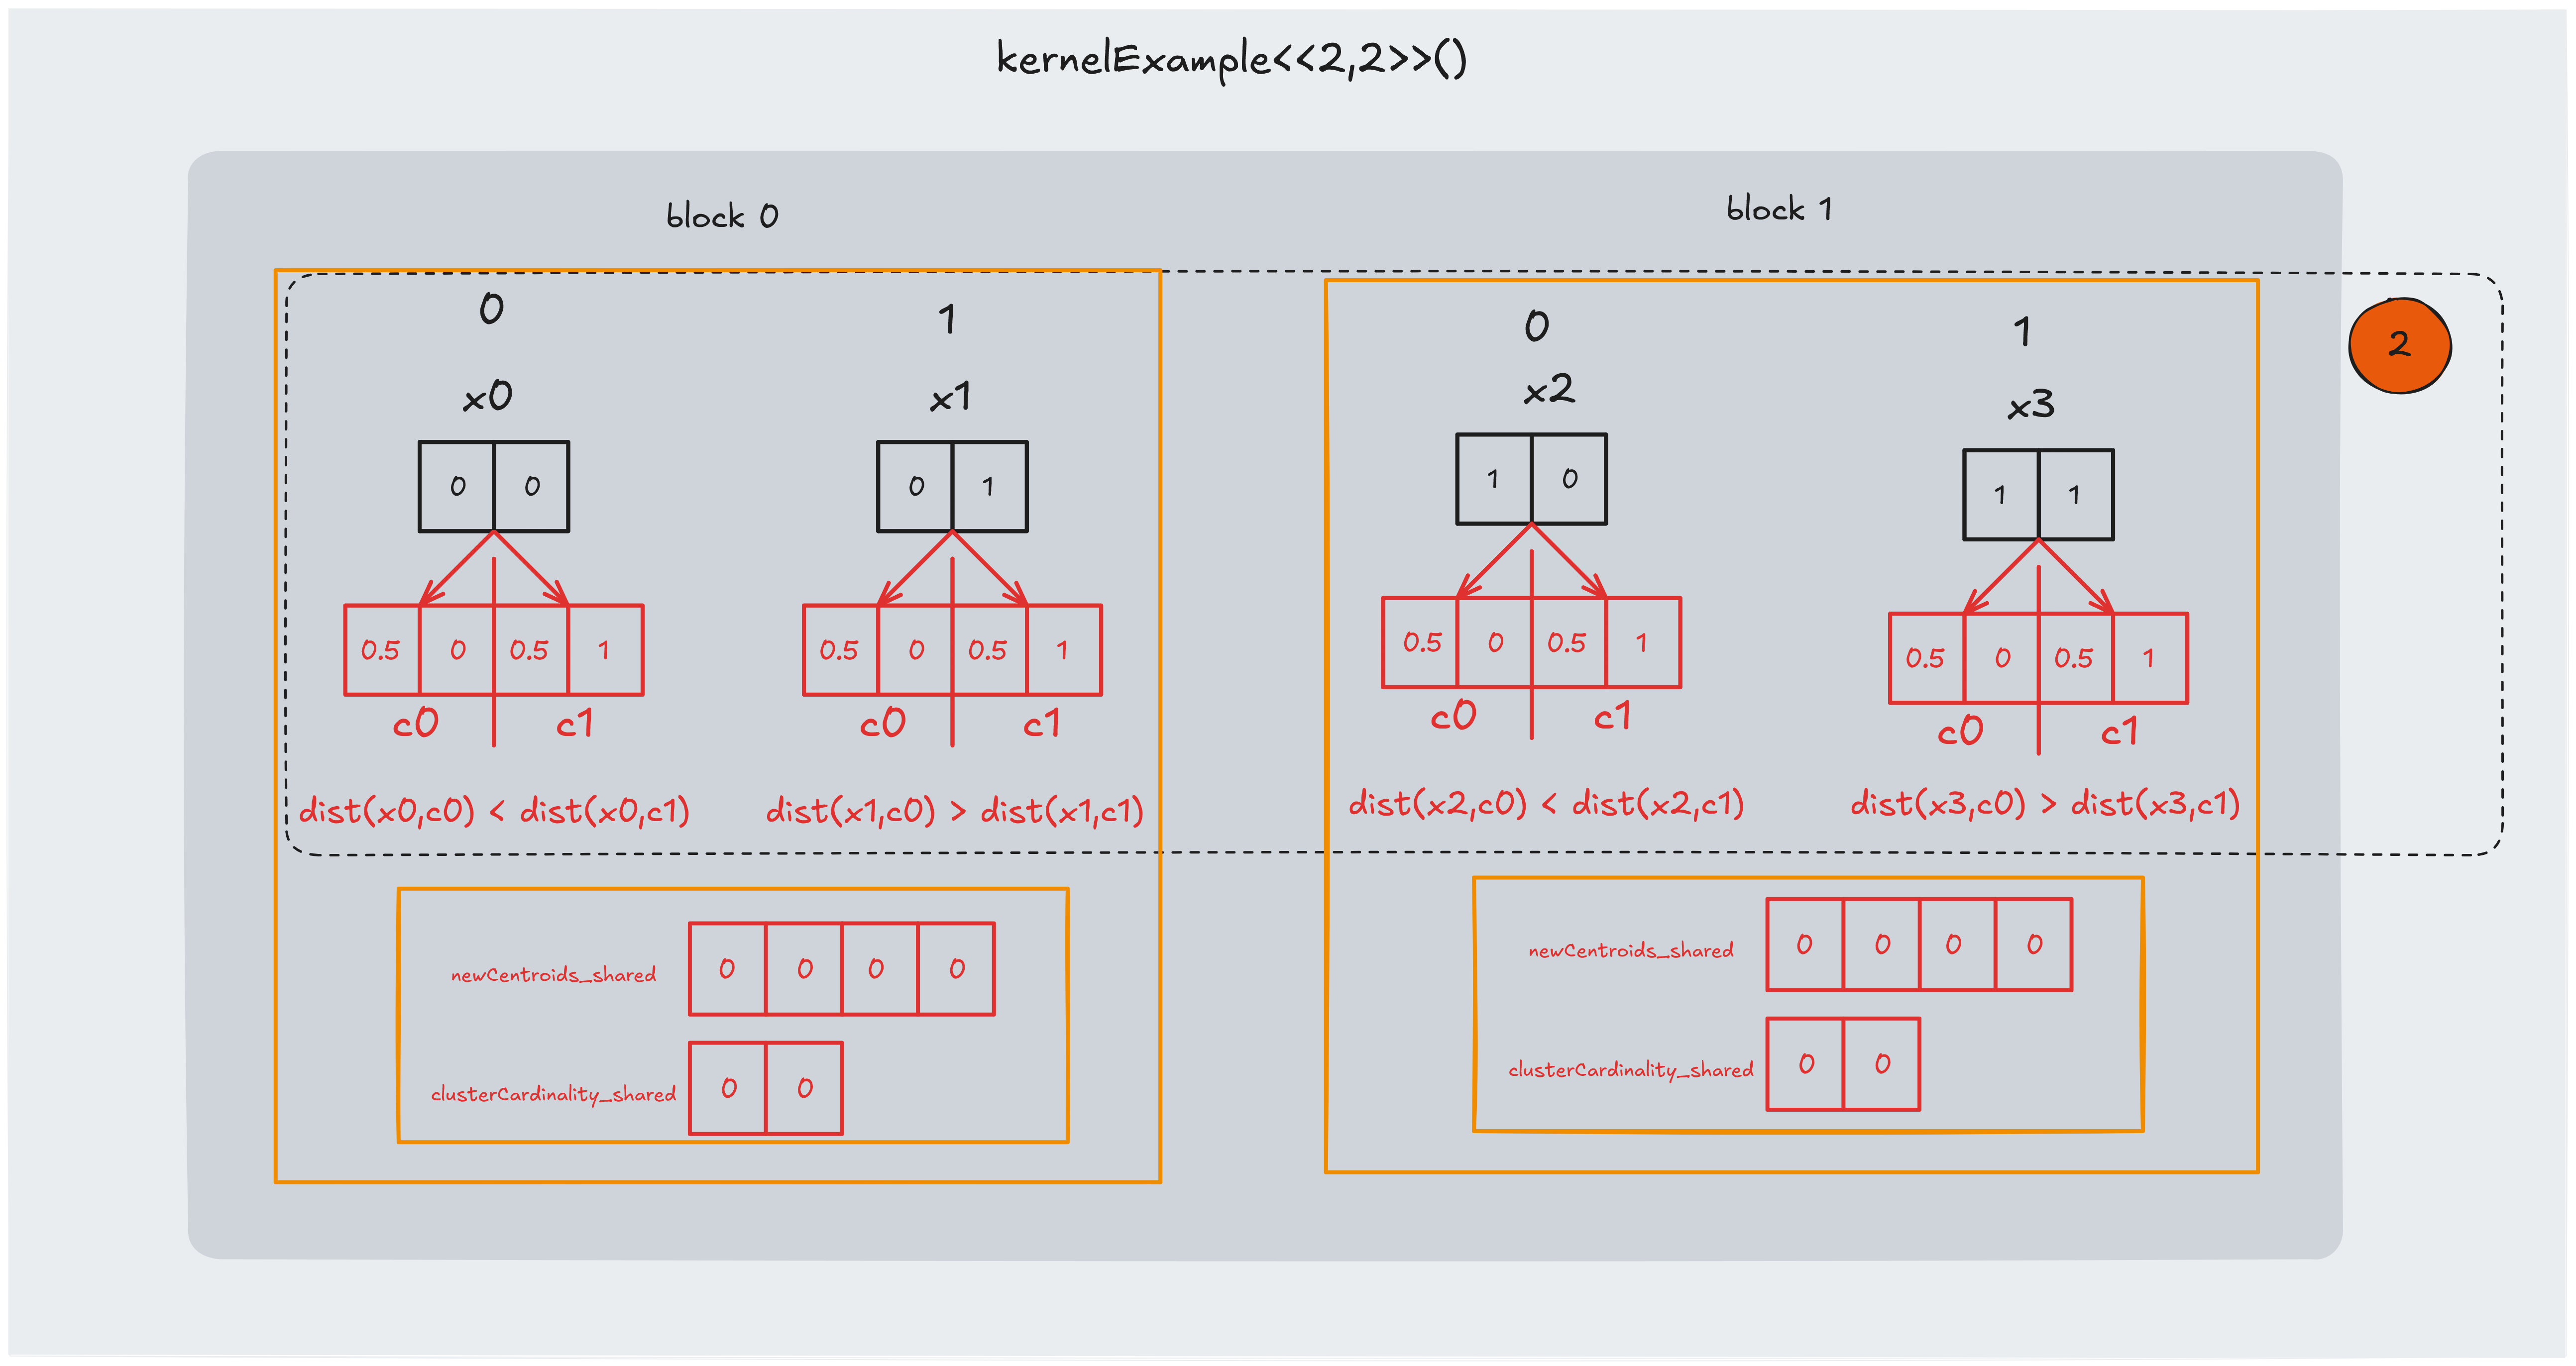
Part 2: assigning closer centroid
In this section we perform the “true parallel computation” of the K-means assignment step. For each data point, we compute the distance to every centroid and determine which centroid is closest.
The code snippet below illustrates this process:
float minDistance = INFINITY;
int clusterLabel = 0;
for (int j = 0; j < K; ++j) {
	float distance = distanceMetric(dataPoints_dev[index*2],dataPoints_dev[index*2+1],
									centroids_dev[j*2],centroids_dev[j*2+1]);
	if(distance < minDistance){
		minDistance = distance;
		clusterLabel = j;
	}
}
clusterLabel_dev[index] = clusterLabel;
In the example we found that:
- $dist(x0,c0) < dist(x0,c1)$, so we assign $c0$ to $x0$
- $dist(x1,c0) > dist(x1,c1)$, so we assign $c1$ to $x1$
- $dist(x2,c0) < dist(x2,c1)$, so we assign $c0$ to $x2$
- $dist(x3,c0) > dist(x3,c1)$, so we assign $c1$ to $x3$
Part 3: updating shared memory
In this section, we update the shared memory arrays with the results computed in step 2. Each thread adds its own data point’s coordinates to the corresponding centroid’s accumulator in shared memory.
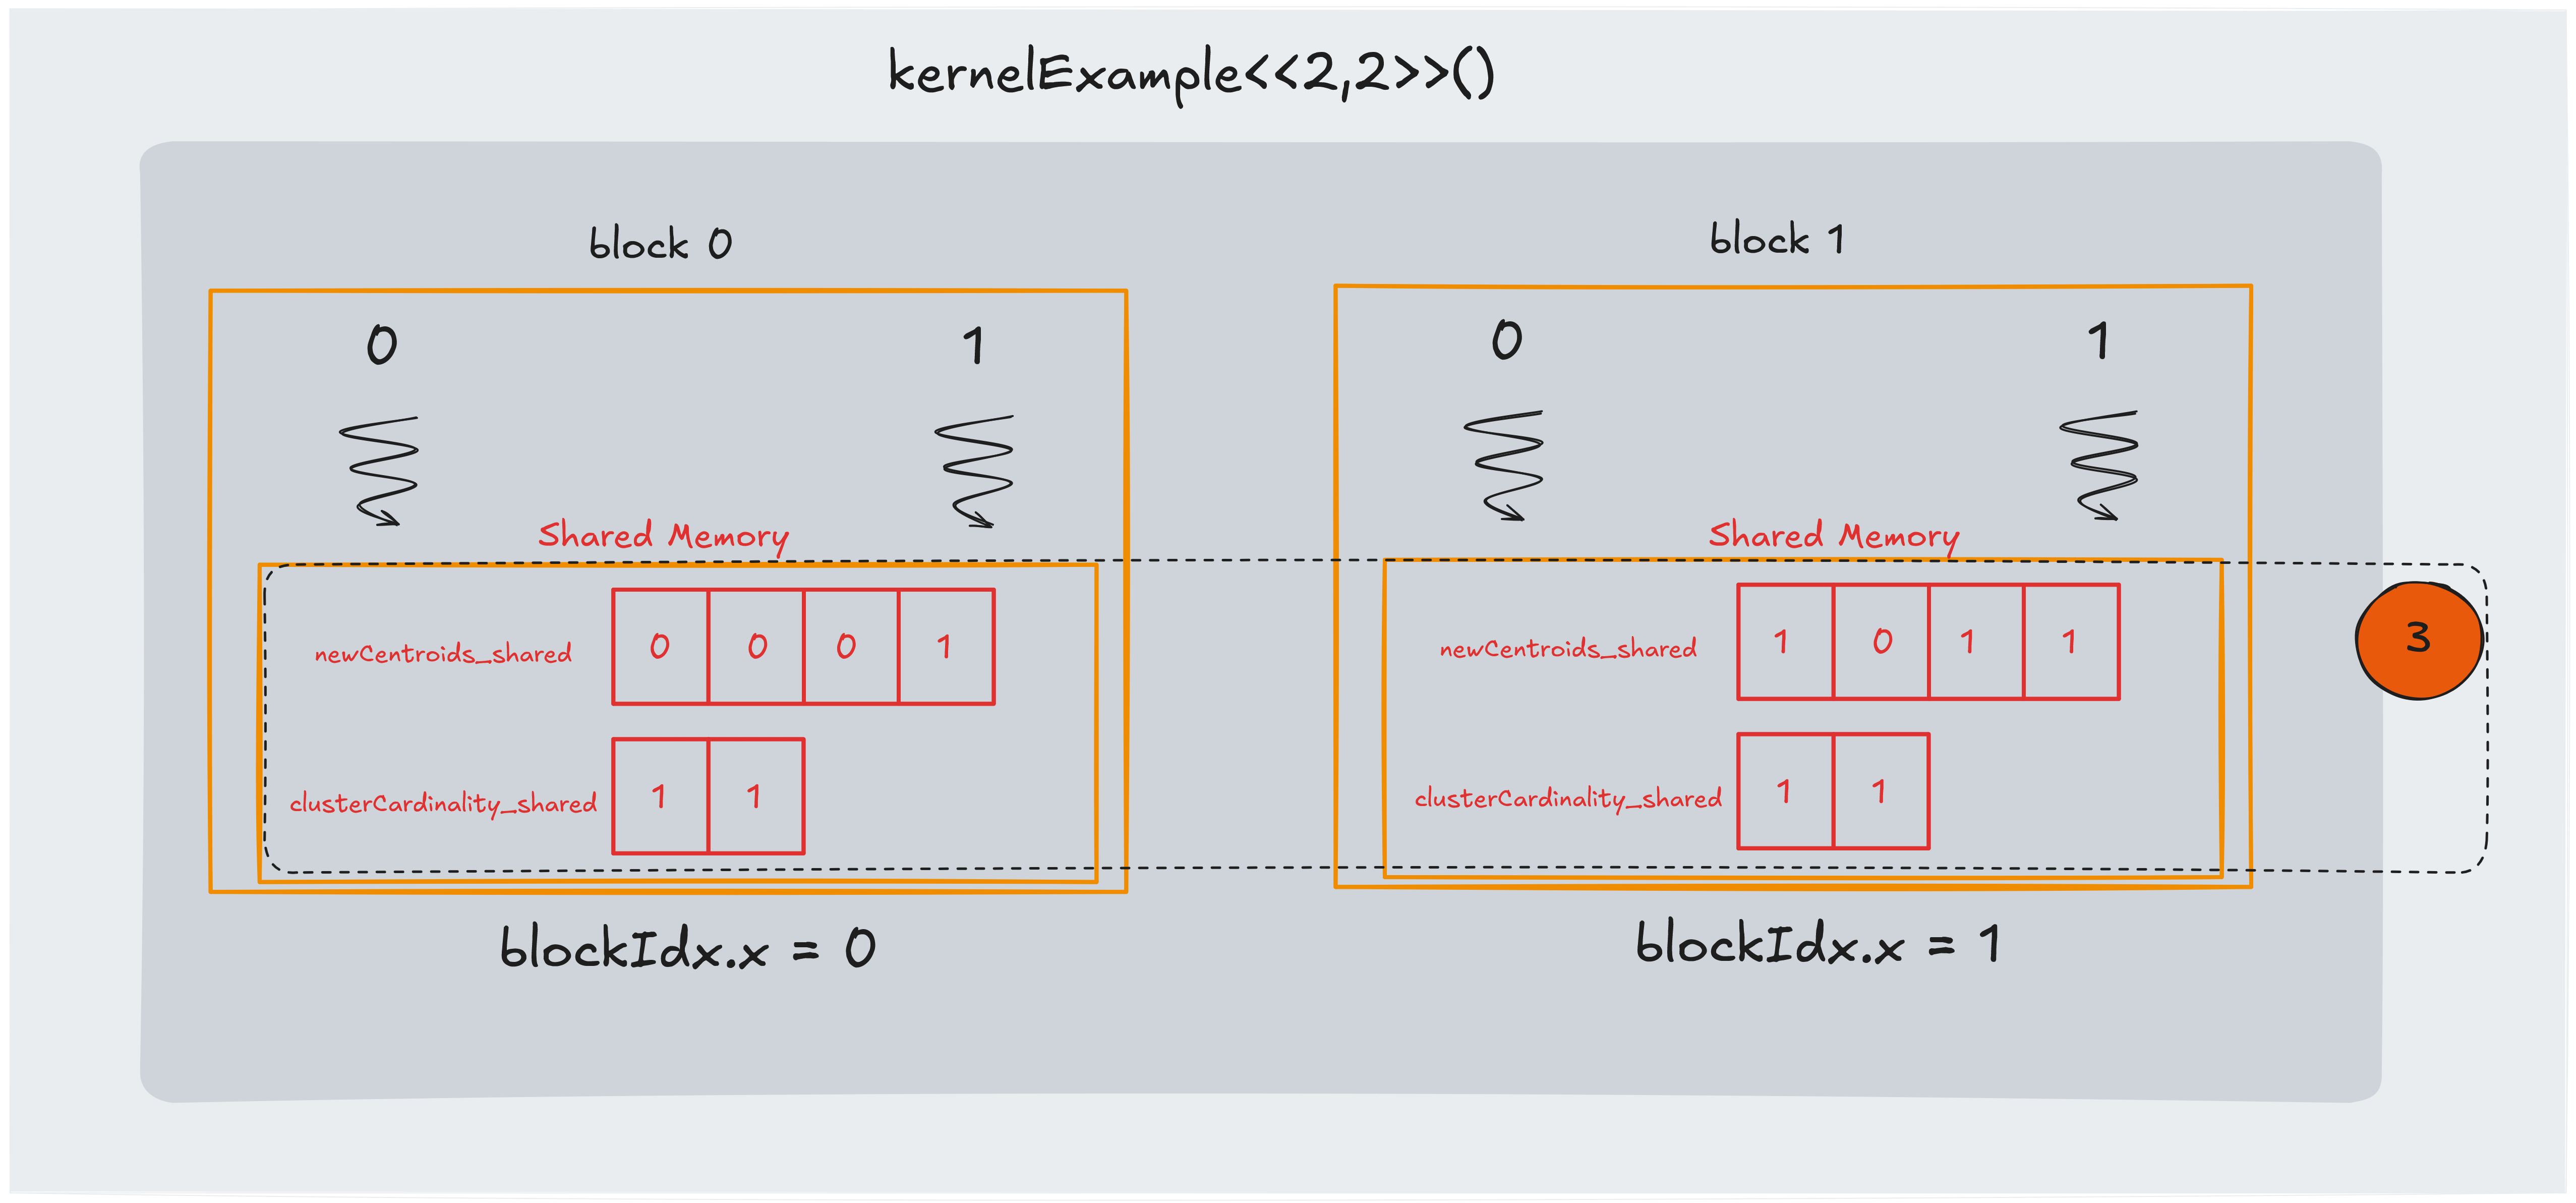
In the example:
- $dist(x0,c0) < dist(x0,c1)$, so we update newCentroids_shared[0] with $x0.x$ and newCentroids_shared[1] with $x0.y$
- $dist(x1,c0) > dist(x1,c1)$, so we update newCentroids_shared[2] with $x1.x$ and newCentroids_shared[3] with $x1.y$
- $dist(x2,c0) < dist(x2,c1)$, so we update newCentroids_shared[0] with $x2.x$ and newCentroids_shared[1] with $x2.y$
- $dist(x3,c0) > dist(x3,c1)$, so we update newCentroids_shared[2] with $x3.x$ and newCentroids_shared[3] with $x3.y$
Because several threads within the same block might update the same centroid accumulator concurrently, this update phase is susceptible to race conditions.
To avoid this, we use atomicAdd to ensure that each update is performed safely.
atomicAdd(&(newCentroids_shared[clusterLabel*2]), dataPoints_dev[index*2]);
atomicAdd(&(newCentroids_shared[clusterLabel*2 + 1]), dataPoints_dev[index*2 + 1]);
atomicAdd(&(clusterCardinality_shared[clusterLabel]),1);
After this update, it is crucial to synchronize again all threads with:
__syncthreads();
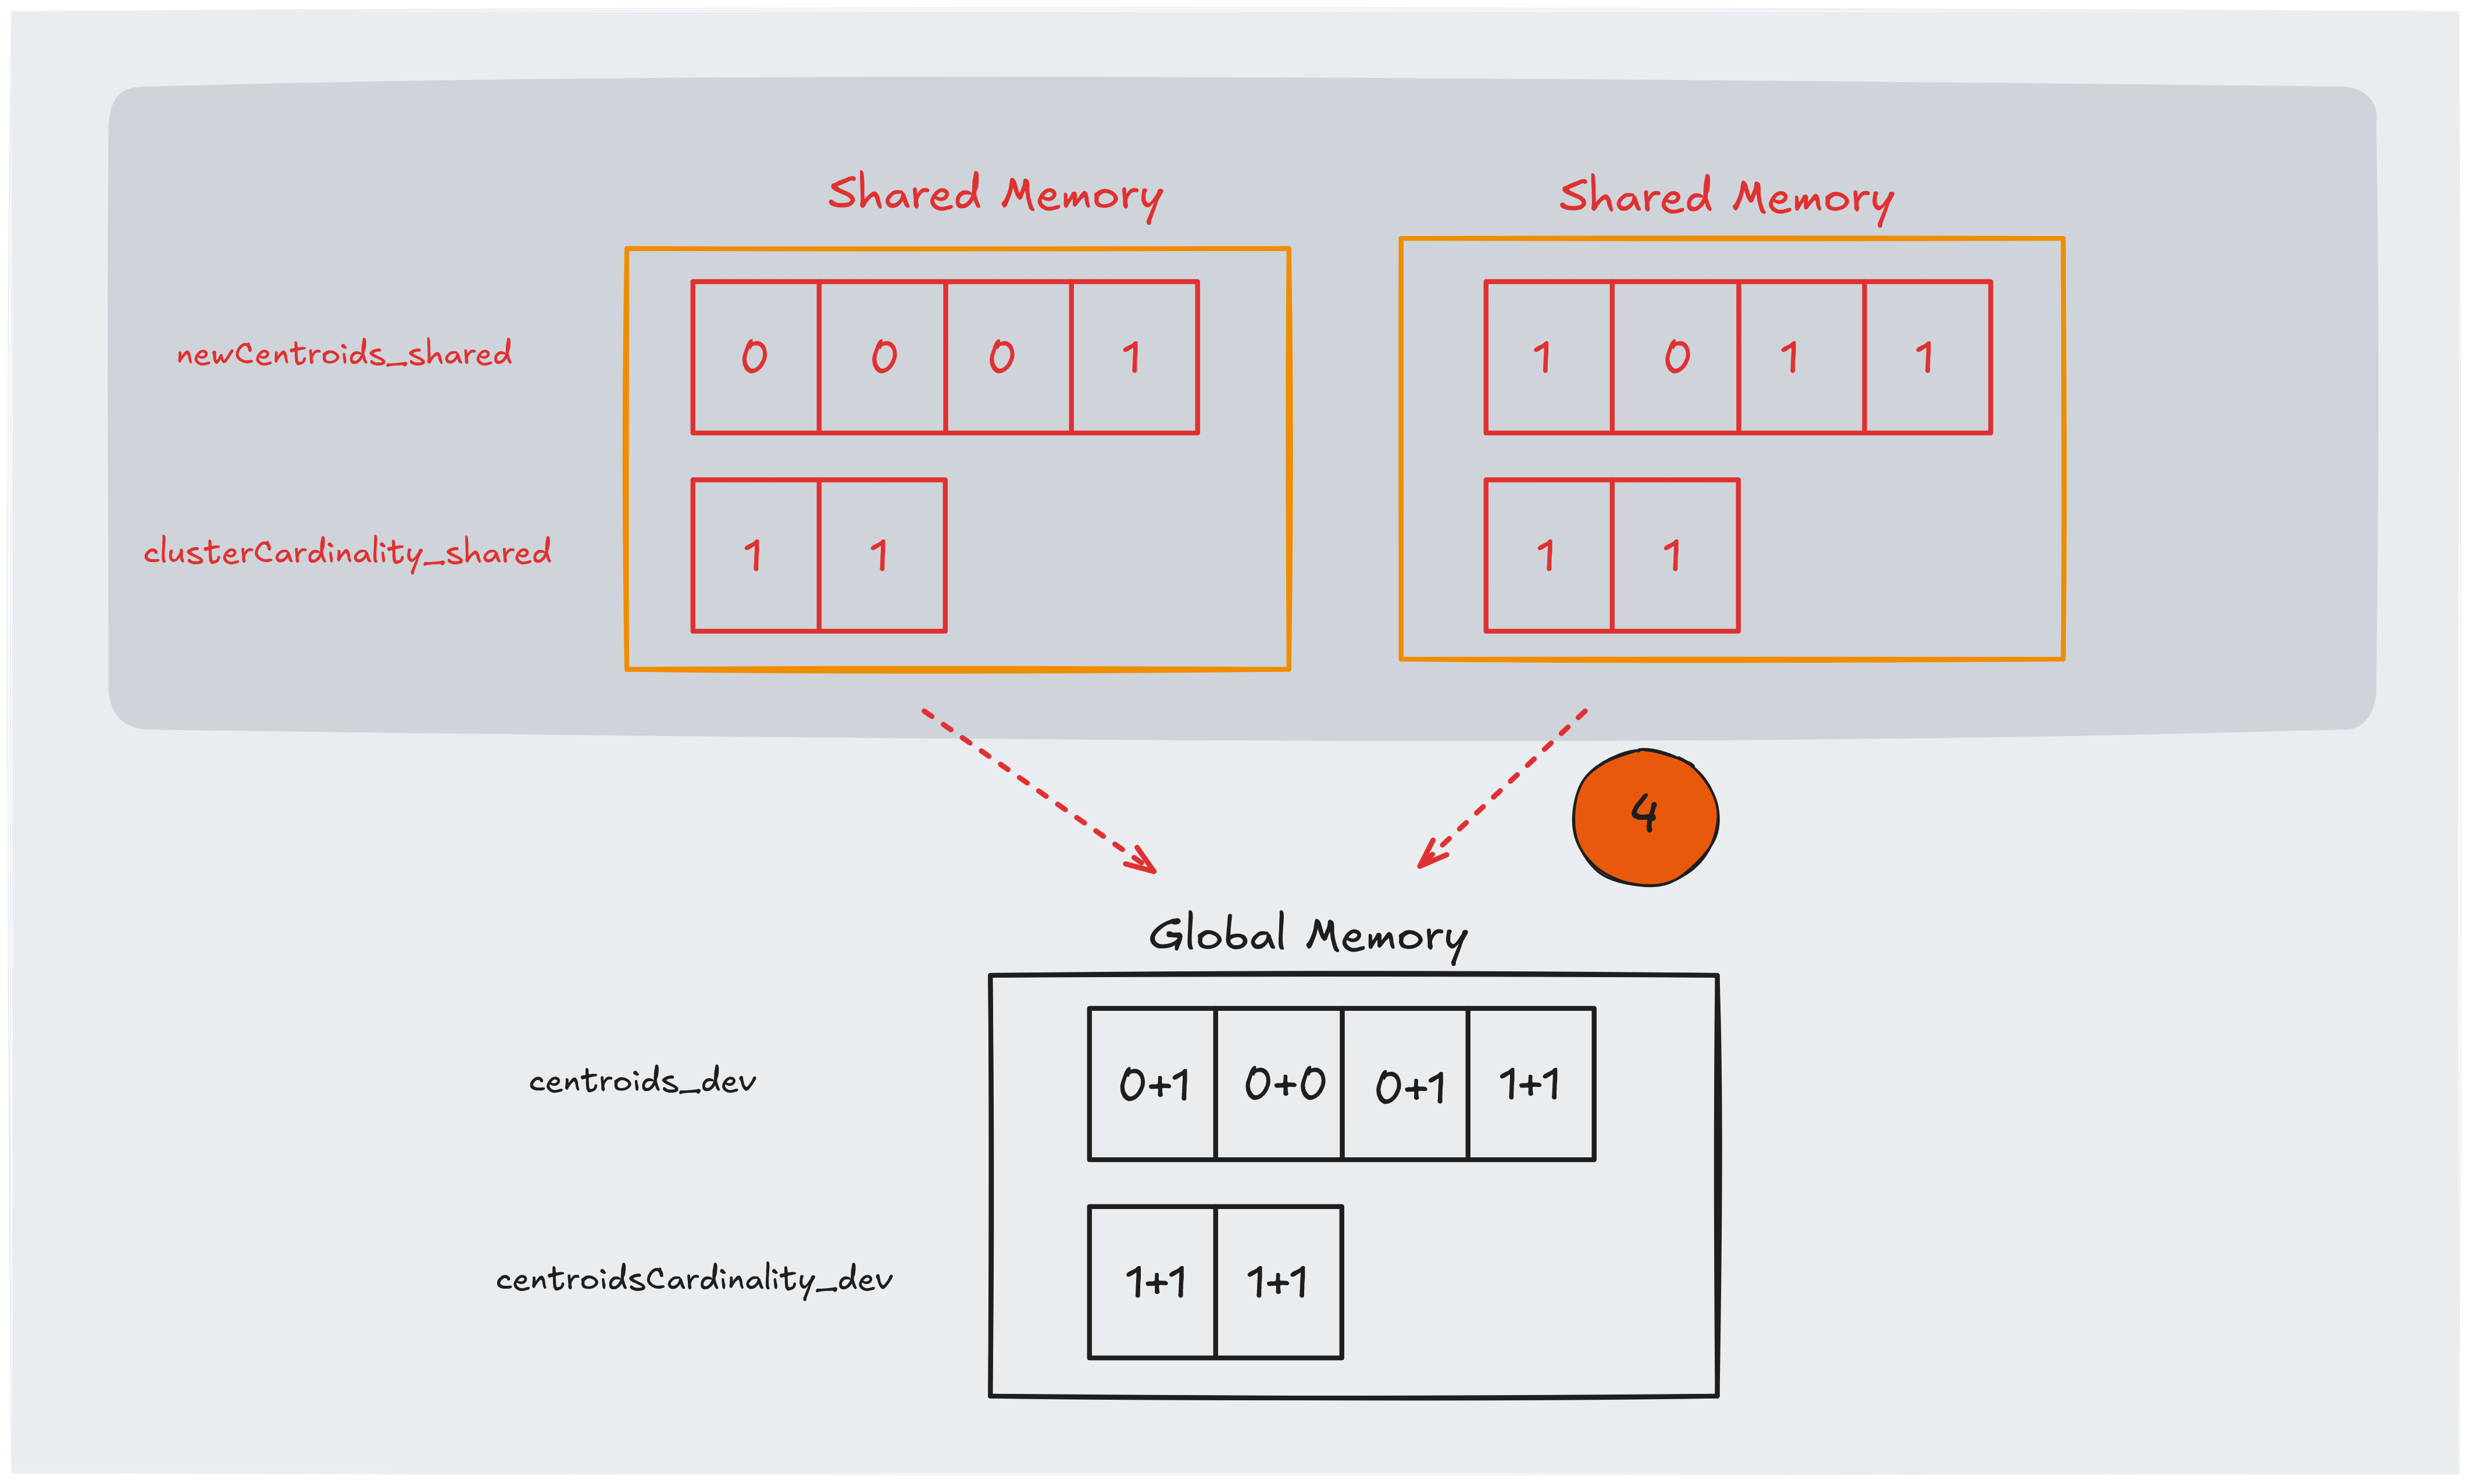
Part 4: perform reduction
In this final stage, we transfer the intermediate results stored in shared memory back to global memory.
At this point, each block has accumulated partial sums (for the centroids’ coordinates) and counts (for the number of points assigned to each centroid) in its shared arrays.
To combine these results, we perform a reduction where each thread, with a stride of blockDim.x, atomically adds its share of the data to the global arrays.
This ensures that even if multiple threads update the same global memory location, the operations occur safely and without data races.
The use of atomicAdd ensures that these updates are performed safely in a parallel environment.
for(int i = localIndex; i < K; i+= blockDim.x) {
	atomicAdd(&(newCentroids_dev[i*2]), newCentroids_shared[i*2]);
	atomicAdd(&(newCentroids_dev[i*2+1]), newCentroids_shared[i*2+1]);
	atomicAdd(&(clusterCardinality_dev[i]), clusterCardinality_shared[i]);
}
Speedup analysis
Now it’s time to dive into some numbers. The CUDA implementation is dramatically faster than the sequential version. To quantify the improvement, independent of the test hardware, we can measure the speedup. The performance gains depend heavily on both the number of centroids $K$ and the total number of data points.
Let’s break down the findings:
$K=5$:
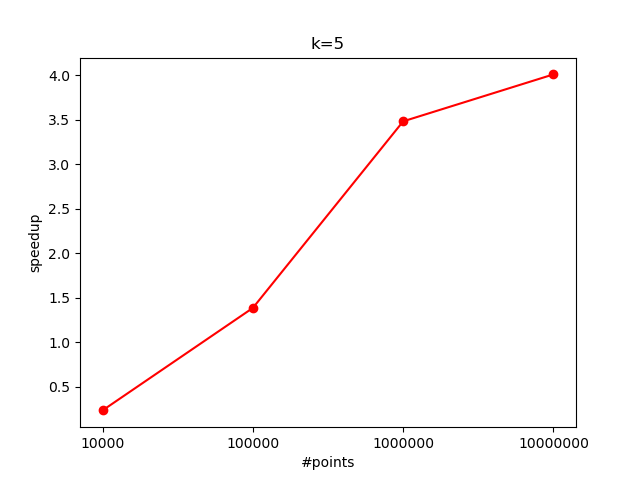
When processing $10^7$ data points, we observed a speedup of approximately $4$x over the sequential version. However, as the number of data points decreases, the speedup also diminishes. This is likely because the overhead of kernel launches and memory transfers becomes more significant when there is less work per kernel call.
$K=100$ and $K=1000$:
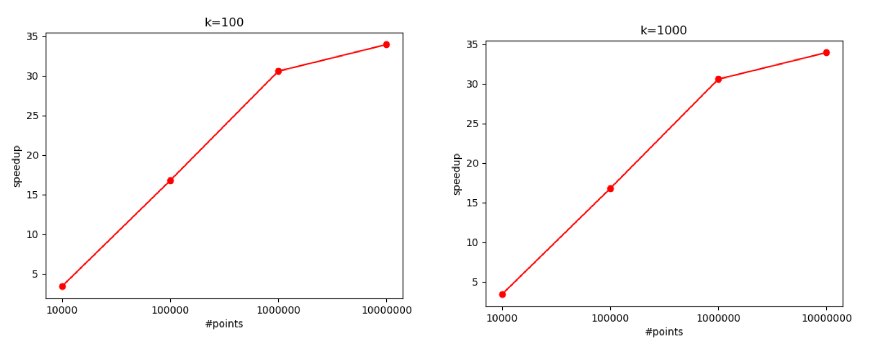
The increased computational load per data point (due to more centroid comparisons) allows the GPU to better utilize its parallel processing capabilities. Here, the speedup reaches around $35$x with $10^7$ points.
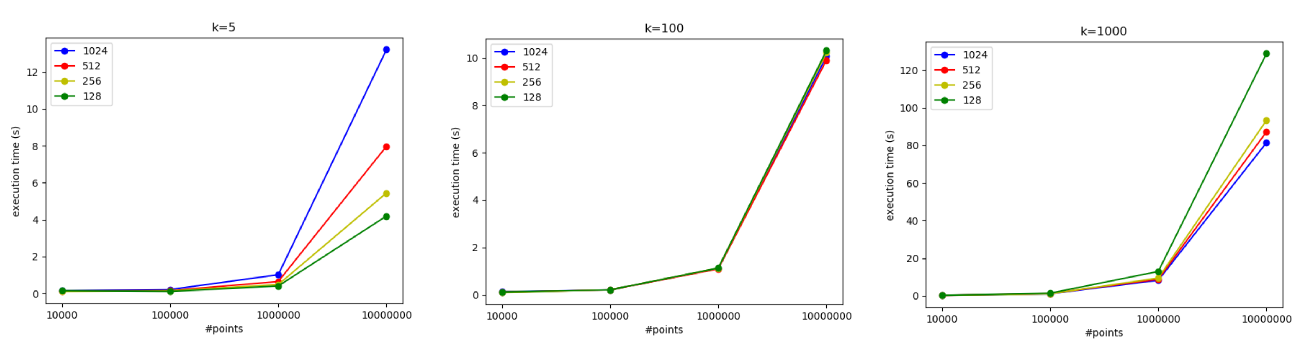
Effects of Threads per Block (TPB)
It is also possibl to experiment varying the number of threads per block:
-
For $K=5$: Using 1024 threads per block turned out to be the slowest configuration. With a small number of centroids, having too many threads may lead to underutilization and increased synchronization overhead.
-
For $K=100$: The performance was roughly the same for different thread block sizes (128, 256, 512, and 1024 TPB). With a moderate workload per data point, the choice of thread block size has a less pronounced effect.
-
For $K=1000$: The best performance was achieved with 1024 threads per block. Here, the heavy computational load per data point benefits from a larger number of threads, which helps hide memory latency and improves overall throughput.
Profiling with nvprof
To pinpoint any performance bottlenecks, it is possible to use nvprof to profile the CUDA kernels.
For $100$ centroids (and $10^6$ points), the profiling output is:
$ sudo nvprof ./build/kmeansCuda datasetUtils/generatedDatasets/1000000_100.csv datasetUtils/generatedDatasets/1000000_100_centroids.csv
==262564== NVPROF is profiling process 262564, command: ./build/kmeansCuda datasetUtils/generatedDatasets/1000000_100.csv datasetUtils/generatedDatasets/1000000_100_centroids.csv
1.43203
==262564== Profiling application: ./build/kmeansCuda datasetUtils/generatedDatasets/1000000_100.csv datasetUtils/generatedDatasets/1000000_100_centroids.csv
==262564== Profiling result:
            Type  Time(%)      Time     Calls       Avg       Min       Max  Name
 GPU activities:   98.99%  975.56ms       100  9.7556ms  9.6824ms  11.268ms  centroidAssignAndUpdate(float*, float*, float*, int*, int*, int)
                    0.53%  5.2572ms       102  51.540us  1.2800us  5.1211ms  [CUDA memcpy HtoD]
                    0.42%  4.1601ms       201  20.696us  1.6000us  3.8152ms  [CUDA memcpy DtoH]
                    0.05%  507.58us       200  2.5370us  2.4320us  3.1360us  [CUDA memset]
      API calls:   80.00%  991.43ms       303  3.2721ms  6.7720us  11.295ms  cudaMemcpy
                   19.66%  243.61ms         5  48.722ms  6.7250us  242.39ms  cudaMalloc
                    0.18%  2.2049ms       100  22.049us  17.538us  53.918us  cudaLaunchKernel
                    0.10%  1.2148ms       200  6.0740us  3.2930us  17.932us  cudaMemset
                    0.03%  330.19us        97  3.4040us     333ns  141.52us  cuDeviceGetAttribute
                    0.02%  255.02us         4  63.755us  10.132us  205.25us  cudaFree
                    0.01%  130.96us         1  130.96us  130.96us  130.96us  cuDeviceTotalMem
                    0.01%  95.418us         1  95.418us  95.418us  95.418us  cuDeviceGetName
                    0.00%  18.094us         1  18.094us  18.094us  18.094us  cuDeviceGetPCIBusId
                    0.00%  4.4730us         3  1.4910us     331ns  2.8540us  cuDeviceGetCount
                    0.00%  2.2660us         2  1.1330us     678ns  1.5880us  cuDeviceGet
                    0.00%     587ns         1     587ns     587ns     587ns  cuDeviceGetUuid
Visually (using nvvp),
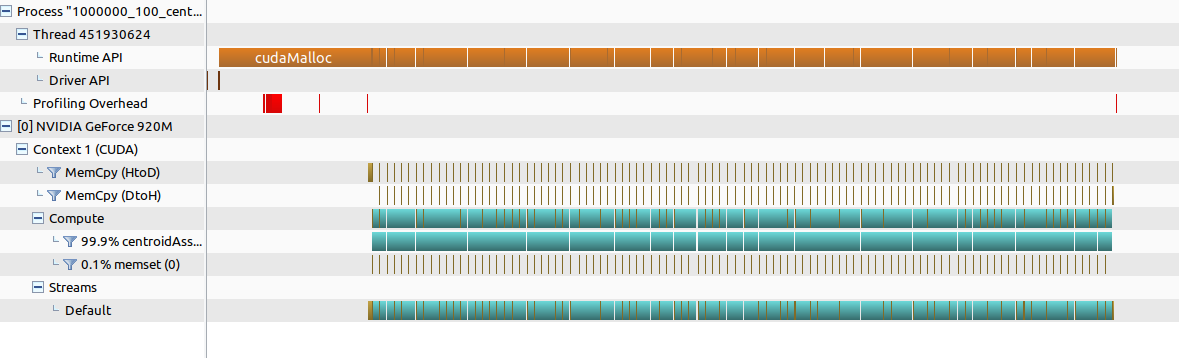
We can see that:
-
The kernel centroidAssignAndUpdate consumes nearly 99% of the GPU time (about 9.76 ms per call). This shows that our main computation is concentrated in this kernel.
-
CUDA memory copy operations (Host-to-Device and Device-to-Host) and memory setting (CUDA memset) take up a very small fraction of the total time. This suggests that data transfers are not the bottleneck.
Splitting kernel - kernel V2
One limitation of the code above is that nvprof does not break down the kernel into its internal operations, so it’s hard to pinpoint exactly which part of the kernel is the slowest. Additionally, I don’t have access to NVIDIA’s detailed GPU code analysis tools on my hardware (running on an old GeForce 920M 🥵).
To further investigate the performance bottleneck, I decided to split the monolithic kernel into two distinct kernels:
- assignmentKernel: Handles the assignment of points to centroids.
- reductionKernel: Manages the reduction of data in global memory.
This separation allows us to test whether the performance issue is due to atomic operations in global memory or the computational load of the assignment phase.
You can find the code (along with every other source) in the github repository (link) under src/kmeansCudaV2.
The nvprof output for the split version (with $K=100$ and $10^6$ datapoints) is:
$ sudo nvprof ./build/kmeansCudaV2 datasetUtils/generatedDatasets/1000000_100.csv datasetUtils/generatedDatasets/1000000_100_centroids.csv
==273366== NVPROF is profiling process 273366, command: ./build/kmeansCudaV2 datasetUtils/generatedDatasets/1000000_100.csv datasetUtils/generatedDatasets/1000000_100_centroids.csv
1.05695
==273366== Profiling application: ./build/kmeansCudaV2 datasetUtils/generatedDatasets/1000000_100.csv datasetUtils/generatedDatasets/1000000_100_centroids.csv
==273366== Profiling result:
            Type  Time(%)      Time     Calls       Avg       Min       Max  Name
 GPU activities:   95.98%  999.10ms       100  9.9910ms  9.8939ms  12.846ms  assignmentKernel(float const *, float const *, int*, float*, int*, int)
                    3.15%  32.830ms       100  328.30us  326.46us  336.22us  reductionKernel(float const *, int const *, float*, int*, int)
                    0.50%  5.2460ms       102  51.431us  1.2800us  5.1107ms  [CUDA memcpy HtoD]
                    0.34%  3.5403ms       201  17.613us  1.7920us  3.1501ms  [CUDA memcpy DtoH]
                    0.02%  209.95us       200  1.0490us     992ns  1.3120us  [CUDA memset]
      API calls:   80.24%  1.03968s       200  5.1984ms  324.65us  12.862ms  cudaDeviceSynchronize
                   17.97%  232.80ms         7  33.257ms  6.5090us  231.38ms  cudaMalloc
                    1.11%  14.347ms       303  47.349us  6.1190us  4.3944ms  cudaMemcpy
                    0.28%  3.5906ms       200  17.953us  8.0470us  194.08us  cudaLaunchKernel
                    0.22%  2.7953ms       200  13.976us  8.1290us  48.483us  cudaMemset
                    0.15%  1.9781ms         7  282.59us  6.3570us  896.87us  cudaFree
                    0.03%  334.03us        97  3.4430us     354ns  142.80us  cuDeviceGetAttribute
                    0.01%  124.37us         1  124.37us  124.37us  124.37us  cuDeviceTotalMem
                    0.01%  70.203us         1  70.203us  70.203us  70.203us  cuDeviceGetName
                    0.00%  14.030us         1  14.030us  14.030us  14.030us  cuDeviceGetPCIBusId
                    0.00%  4.1100us         3  1.3700us     376ns  3.2130us  cuDeviceGetCount
                    0.00%  2.3860us         2  1.1930us     408ns  1.9780us  cuDeviceGet
                    0.00%     634ns         1     634ns     634ns     634ns  cuDeviceGetUuid
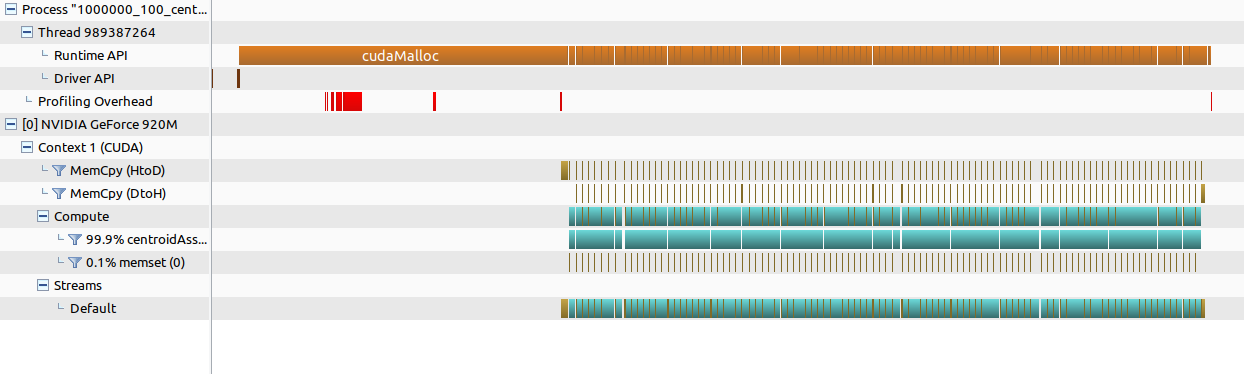
Visually

We can observe that
-
assignmentKernel: This kernel still takes up about 96% of the GPU execution time (averaging roughly 10 ms per call). This indicates that the bulk of the computational load remains in the assignment phase. So the atomics in the reduction phase are not the bottleneck.
-
reductionKernel: The reduction step accounts for only about 3% of the GPU time, suggesting that atomic operations in global memory (often a concern with reductions) are not the main performance issue.
In summary, while the CUDA implementation scales very well and achieves significant speedup over the sequential version, the profiling data indicates that our primary focus for further optimization should be on the assignment phase of the algorithm rather than the atomic operations used in global memory.
Achieving 100x speedup - kernel V3
At the beginning of this post i made a claim about 100x speedup, you trusted me until now, but i want you to see which change made the speedup from 35x to +100x speedup!
From the sections above we know for sure that the bottleneck is before the atomic operations happening in global memory, so it has to be here:
float minDistance = INFINITY;
int clusterLabel = 0;
for (int j = 0; j < K; ++j) {
	float distance = distanceMetric(dataPoints_dev[index * 2], dataPoints_dev[index * 2 + 1],
                                centroids_dev[j * 2], centroids_dev[j * 2 + 1]);
	if (distance < minDistance){
        minDistance = distance;
        clusterLabel = j;
    }
}
clusterLabel_dev[index] = clusterLabel;
atomicAdd(&(newCentroids_shared[clusterLabel*2]), dataPoints_dev[index*2]);
atomicAdd(&(newCentroids_shared[clusterLabel*2 + 1]), dataPoints_dev[index*2 + 1]);
atomicAdd(&(clusterCardinality_shared[clusterLabel]),1);
If we look at this code closely, it is calculating the distance from a point to every centroids ($K$). But the centroids are in global memory!
So what is happening is that we are doing $K$ access to the GPU DRAM for each thread. We can do better and “cache” those centroids.
__global__ void centroidAssignAndUpdate(float *dataPoints_dev,  float *centroids_dev, float *newCentroids_dev, int *clusterCardinality_dev,int*clusterLabel_dev, int N){

	... same code as before ...

    __shared__ float newCentroids_shared[2*K];
    __shared__ int clusterCardinality_shared[K];
    __shared__ float centroids_shared[2*K]; // Add a shared copy of all centroids!

    for(int i = localIndex; i < 2*K; i += blockDim.x) {
        newCentroids_shared[i] = 0.0;
        centroids_shared[i] = centroids_dev[i];
        if (i < K) {
            clusterCardinality_shared[i] = 0;
        }
    }

    __syncthreads();
    float minDistance = INFINITY;
    int clusterLabel = 0;
    for (int j = 0; j < K; ++j) {
        float distance = distanceMetric(dataPoints_dev[index*2], dataPoints_dev[index*2+1],
                                        centroids_shared[j*2], centroids_shared[j*2+1]);
										// Calculate the distance to centroids accessing the shared memory!
        if(distance < minDistance){
            minDistance = distance;
            clusterLabel = j;
        }
    }
    clusterLabel_dev[index] = clusterLabel;
    atomicAdd(&(newCentroids_shared[clusterLabel*2]), dataPoints_dev[index*2]);
    atomicAdd(&(newCentroids_shared[clusterLabel*2 + 1]), dataPoints_dev[index*2 + 1]);
    atomicAdd(&(clusterCardinality_shared[clusterLabel]),1);
    __syncthreads();


	... same code as before...

}
Time for some speedup analysis:
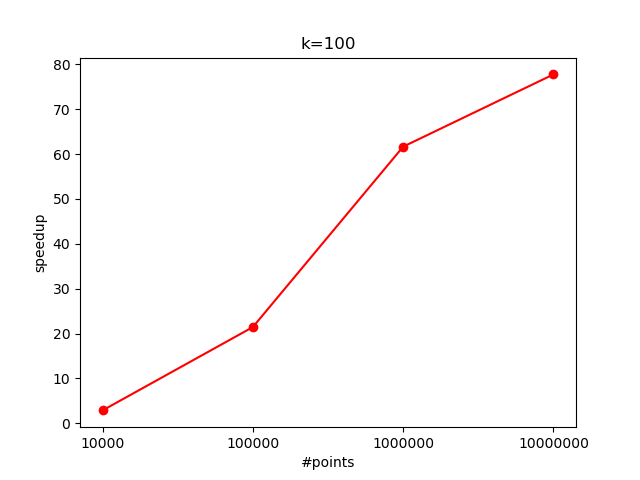
With $K=100$:
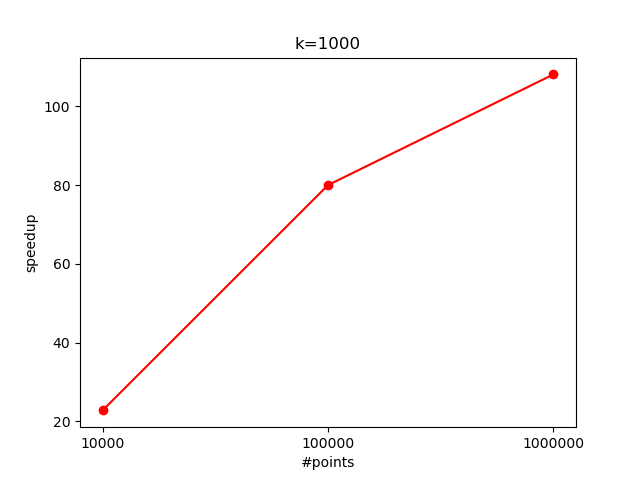
And $K=1000$:

As promised, we got the +100x speedup! 🚀
I would have liked to test it for more points and centroids but my CPU explicitely said to me that i can’t 😅. You can also see the output from the visual profiling tool:
Can we achieve more speed? - kernel V4
One thing i did not talk about is what happens after the kernel finishes. In every kernel so far, centroids are copied back to the host memory and their coordinates is divided by their cardinality.
centroidAssignAndUpdate<<<gridSize, blockSize>>>(...);
cudaMemcpy(newCentroids, newCentroids_dev, K*2*sizeof(float), cudaMemcpyDeviceToHost);
cudaMemcpy(clusterCardinality, clusterCardinality_dev, K*sizeof(int), cudaMemcpyDeviceToHost);
for (int i = 0; i < K; ++i) {
	int cardinality = clusterCardinality[i];
	if (cardinality <= 0) continue;
	centroids[i*2] = newCentroids[i*2] / cardinality;
	centroids[i*2+1] = newCentroids[i*2+1] / cardinality;
}
cudaMemcpy(centroids_dev, centroids, K*2*sizeof(float), cudaMemcpyHostToDevice);
This operations is purely sequential, and if $K$ is big enough i would think that the overhead of launching another kernel is worth the effort.
We can create another kernel updateCentroids that does that:
centroidAssignAndUpdate<<<gridSize, blockSize>>>(...);
cudaDeviceSynchronize();
updateCentroids<<<(K+THREAD_PER_BLOCK-1)/THREAD_PER_BLOCK, THREAD_PER_BLOCK>>>(...);
cudaDeviceSynchronize();
Note: we now need a device synchronization because we are not doing a memcopy which has an implicit synchronization.
We can imagine that now we will have a speedup when the overhead of launching a new kernel is less than the cost of sequentially doing $K$ updates i.e with a large $K$. The speedup i got was similar to the previous version, but again it would have been nice to test it with more points:
Just for fun - openmp parallelization
The sequential code i wrote is very easy to parallelize using openmp - so why not do it and see how it compares with CUDA?
The logic behind this code is very similar to the CUDA version, with the difference that having no concept of blocks, the local variables have a thread scope.
You can find a intuitive guide about openmp here.
void centroidAssignAndUpdate(
    float* dataPoints, float* centroids, float* newCentroids, int* clusterCardinality,
    int* clusterLabel, int N) {

#pragma omp parallel
{
    float newCentroidsLocal[K * 2] = {0.0f};
    int clusterCardinalityLocal[K] = {0};

#pragma omp for schedule(static)
    for (int i = 0; i < N; ++i) {
        float minDistance = INFINITY;
        int cluster = 0;
        for (int j = 0; j < K; ++j) {
            float distance = distanceMetric(dataPoints[i * 2], dataPoints[i * 2 + 1], centroids[j * 2], centroids[j * 2 + 1]);
            if (distance < minDistance) {
                minDistance = distance;
                cluster = j;
            }
        }
        clusterLabel[i] = cluster;
        newCentroidsLocal[cluster * 2] += dataPoints[i * 2];
        newCentroidsLocal[cluster * 2 + 1] += dataPoints[i * 2 + 1];
        clusterCardinalityLocal[cluster]++;
    }

    for (int i = 0; i < K; ++i) {
#pragma omp atomic
        clusterCardinality[i] += clusterCardinalityLocal[i];
#pragma omp atomic
        newCentroids[2*i] += newCentroidsLocal[2*i];
#pragma omp atomic
        newCentroids[2*i+1] += newCentroidsLocal[2*i+1];
    }

}
I didn’t really play much with this implementation. The only thing i saw is that my poor (4) cores where full during the execution:
I was able to produce a speedup of $\approx 3$.
It can be worth investigating cache utilization with tools like perf stat, maybe in a follow up post (?)
Conclusion
In this project, we’ve explored the inner workings of a CUDA implementation of the K-Means clustering algorithm, from understanding the algorithm itself to diving into the nuances of GPU kernel design and optimization. We saw how careful use of shared memory and atomic operations can significantly accelerate the computationally heavy assignment step, leading to impressive speedups over sequential and even CPU-parallelized implementations.
One important aspect we haven’t delved into deeply is dimensionality. While the implementation i presented works for points in 2 dimension, it can be easily extended for more dimension while keeping a SoA architecture.
When working with data points in higher dimensional spaces, the shared memory requirements increase. In our kernel, the memory needed for storing centroids in shared memory scales with both the number of centroids (K) and the dimensionality (dim) of the data. The general formula for shared memory allocation becomes (using kernel V3/4):
$$2 \times (\text{dim} \times K\times 4) + (K\times 4) \leq 49152$$ $$ K \leq \frac{4096}{1 + 2 \times \text{dim}}$$
Increasing the dimensionality of your data will reduce the maximum number of centroids you can store in shared memory. This insight is crucial for scaling the algorithm to more complex, higher dimensional datasets and might prompt alternative strategies, like using dynamic shared memory or even global memory to maintain performance.
All in all, I truly enjoyed diving into CUDA programming. Although the indexing was initially challenging, witnessing the dramatic speedup made the effort incredibly rewarding.